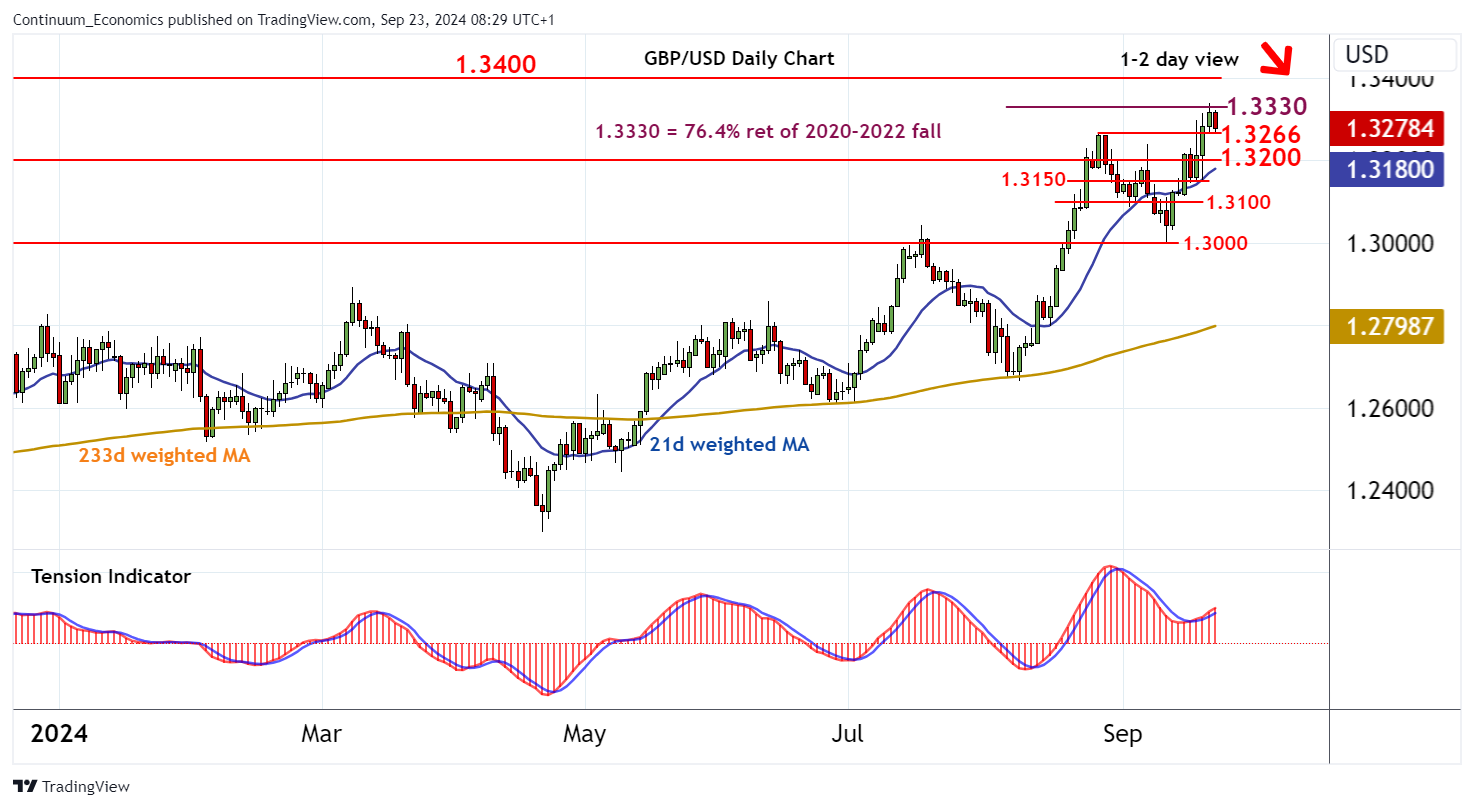
Chart GBP/USD Update: Turning away from the 1.3330 Fibonacci retracement

Cautious trade following the test of strong resistance at the 1.3330 Fibonacci retracement is giving way to a pullback
| Level | Comment | Level | Comment | |||||
|---|---|---|---|---|---|---|---|---|
| R4 | 1.3600 | * | congestion | S1 | 1.3266 | * | 27 Aug (m) high | |
| R3 | 1.3500 | ** | congestion | S2 | 1.3200 | * | congestion | |
| R2 | 1.3400 | * | break level | S3 | 1.3150 | intraday break level | ||
| R1 | 1.3330 | ** | 76.4% ret of 2020-2022 fall | S4 | 1.3100 | intraday break level |
Asterisk denotes strength of level
08:05 BST - Cautious trade following the test of strong resistance at the 1.3330 Fibonacci retracement is giving way to a pullback, as overbought intraday studies unwind. The break below 1.3300 has opened up support at the 1.32566 monthly high of 27 August, but flattening overbought daily stochastics highlight room for a further break beneath here and continuation towards congestion around 1.3200. However, the positive daily Tension Indicator and rising weekly charts suggest fresh buying interest towards here. Meanwhile, a close above 1.3330, not yet seen, would turn sentiment positive once again and extend September 2022 gains initially towards 1.3400.