Published: 2024-06-20T17:01:24.000Z
Chartbook: Chart USD/CHF: Expected to remain under pressure into the coming weeks

Senior Technical Strategist
1
The anticipated rally from just above critical support at the 0.8320 multi-year Fibonacci retracement has met anticipated selling interest just shy of the 0.9245 high of October 2023
The anticipated rally from just above critical support at the 0.8320 multi-year Fibonacci retracement has met anticipated selling interest just shy of the 0.9245 high of October 2023.
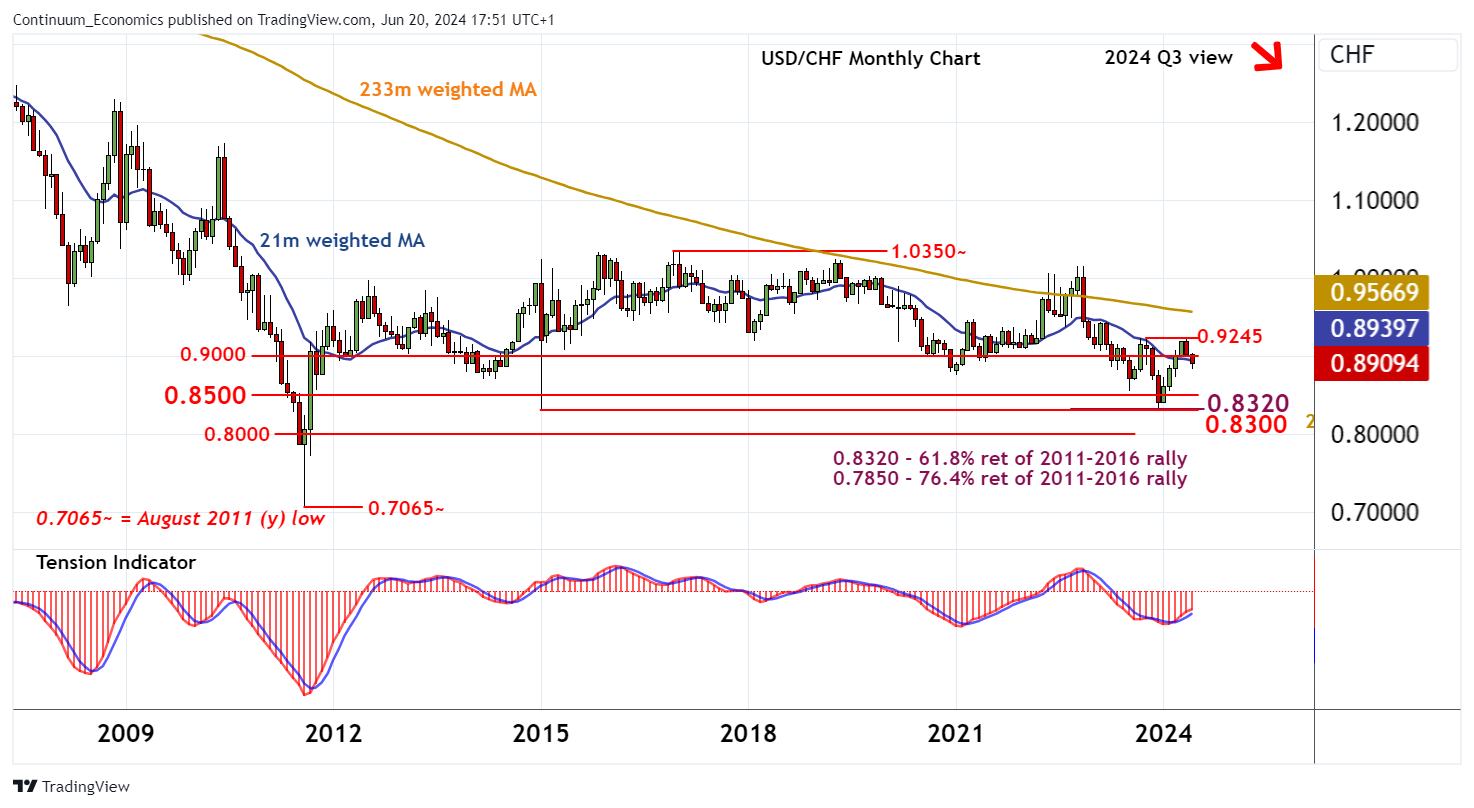
Steady losses are now trading beneath 0.9000, as unwinding overbought monthly stochastics add weight to sentiment.
Further losses are highlighted into early 2024Q3, with a break below the 0.8730 low of March opening up congestion around 0.8500. Still lower is critical support within congestion around 0.8300 and the 0.8320 retracement, but the positive monthly Tension Indicator is expected to limit any initial tests in fresh consolidation.
Longer-term charts are mixed/negative, but a close beneath here is needed to confirm continuation of losses from the 1.0350~ multi-year high of December 2016.
Meanwhile, resistance is at congestion around 0.9000.
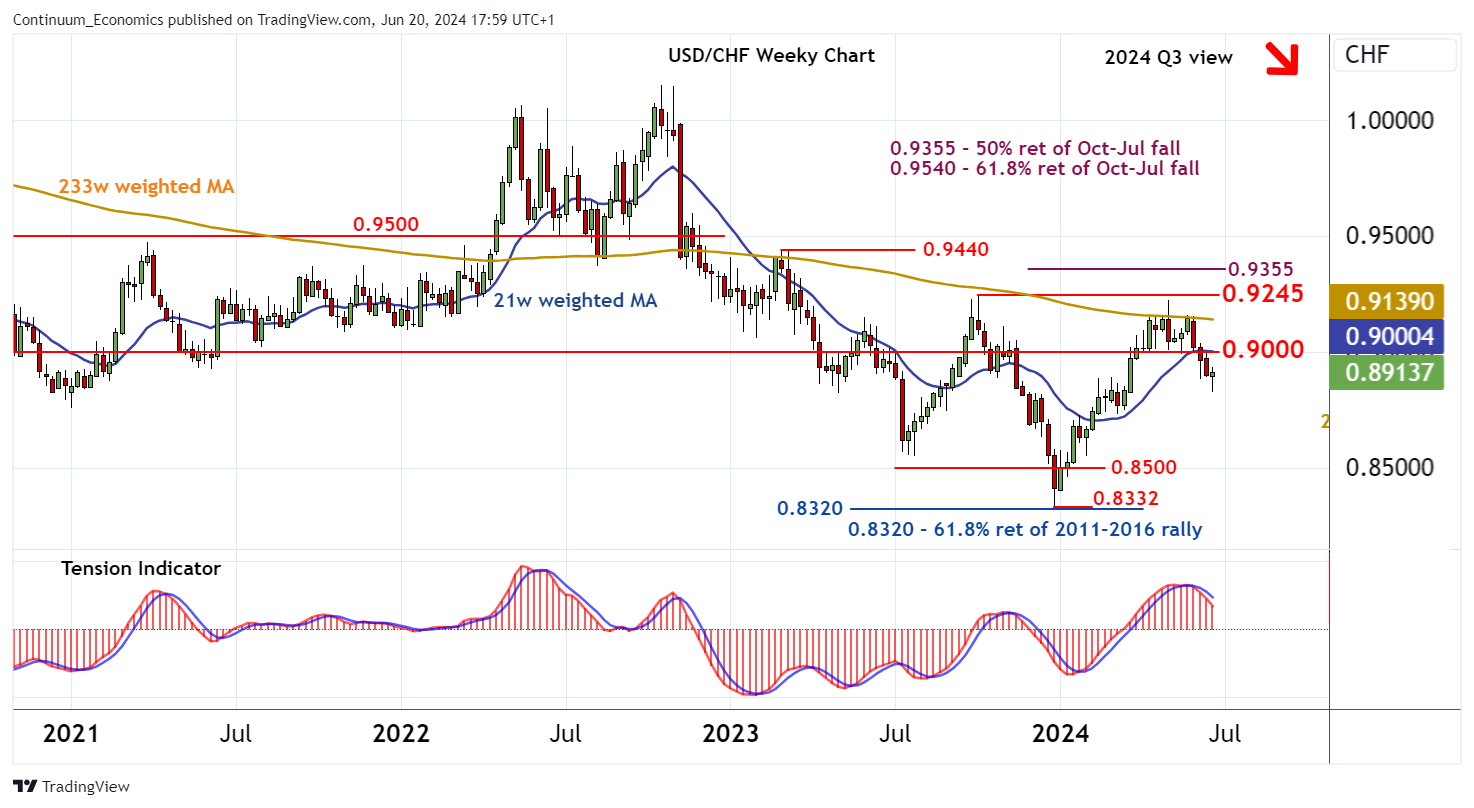
A close above here would turn sentiment neutral and put prices into fresh consolidation beneath 0.9245.
However, a further close above 0.9245, if seen, would turn price action positive once again and extend December 2023 gains initially to the 0.9355 Fibonacci retracement.