Chartbook: US Chart 10 Year Yield: Yield coming under pressure

The anticipated corrective bounce from the 3.783% monthly low of 28 December has met fresh selling interest at 4.739% and brought yields lower.
The anticipated corrective bounce from the 3.783% monthly low of 28 December has met fresh selling interest at 4.739%,
with yields trading lower once again towards congestion support at 4.000%.
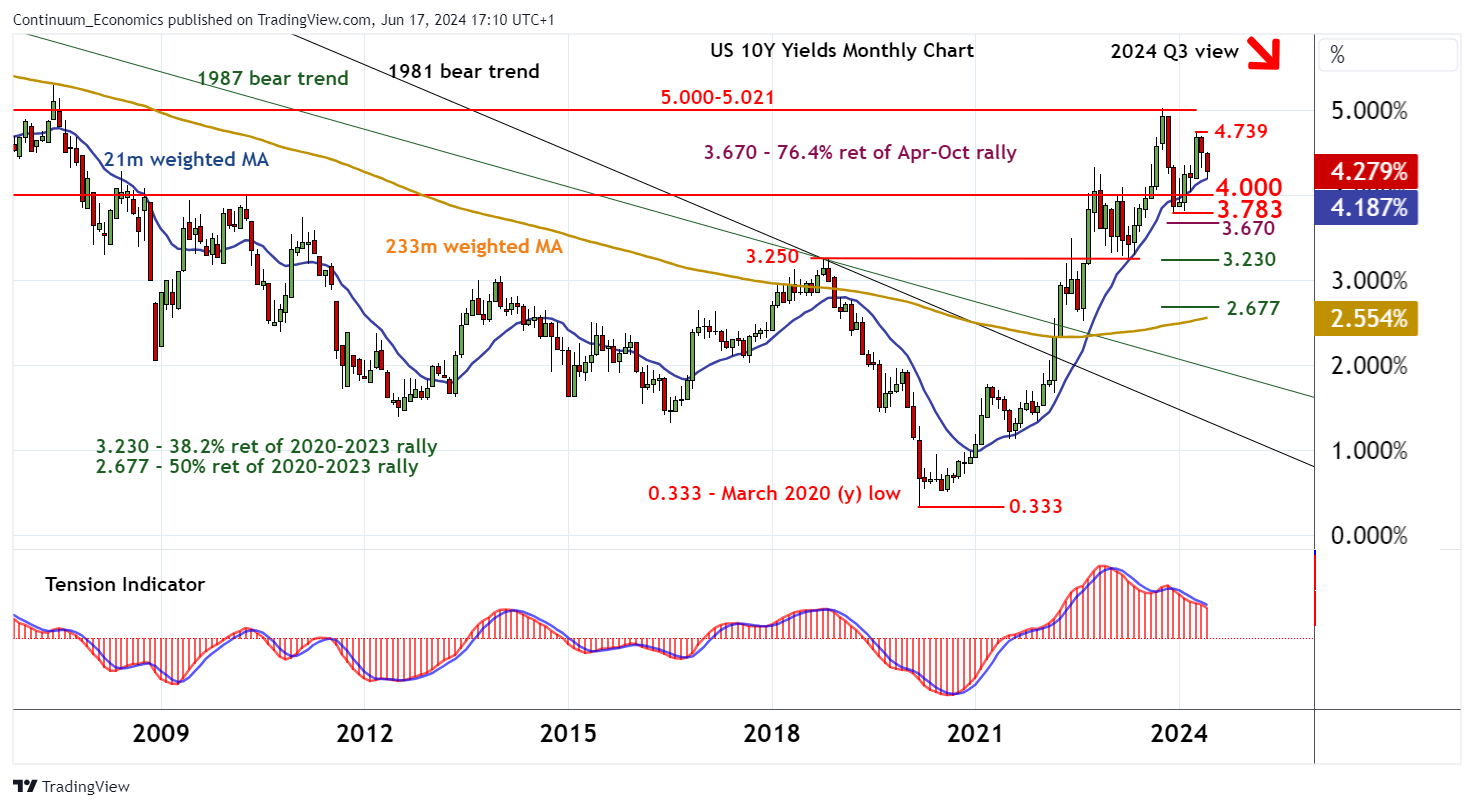
Monthly stochastics are coming under pressure and the monthly Tension Indicator is negative, highlighting a bearish tone and room for deeper losses into early 2024Q3.
A close below 4.000% will open up 3.783%, with a further close beneath here turning sentiment outright negative and confirming continuation of losses from the 5.021% year high of October 2023, initially to the 3.670% Fibonacci retracement. Beneath here is stronger support within 3.230% - 3.250%. But by-then oversold monthly stochastics should limit any initial tests in consolidation.
Meanwhile, resistance is at congestion around 4.500% and extends to the 4.739% current year high of 25 April.
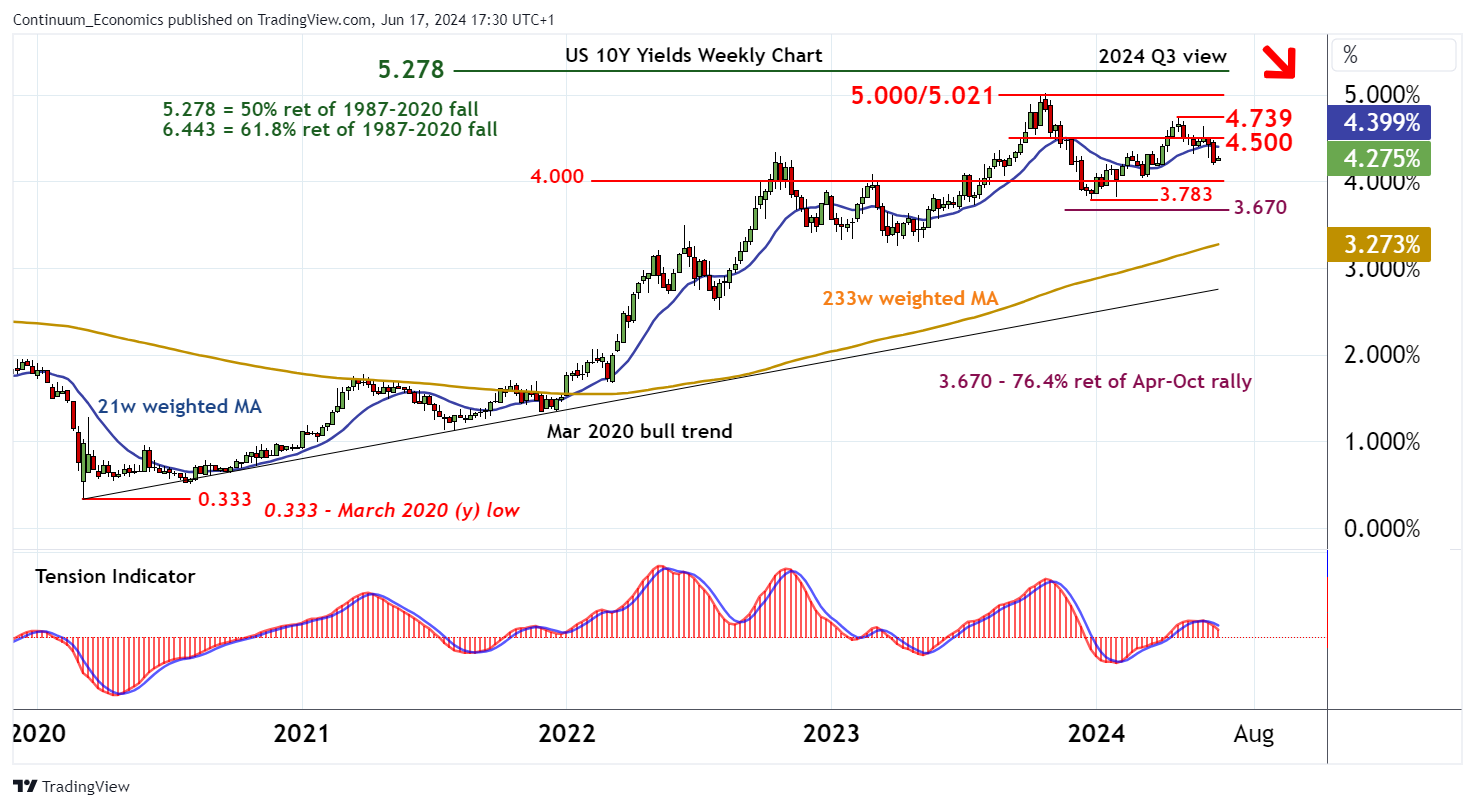
This area is expected to cap any corrective bounce, as weekly charts also come under pressure.
However, a close above here, would improve yield action and put focus back on critical resistance at 5.000% and the 5.021% year high of October 2023. Continuation beyond here would confirm continuation of the bull trend from the 0.333% all-time low of March 2020.