Published: 2024-11-12T13:48:39.000Z
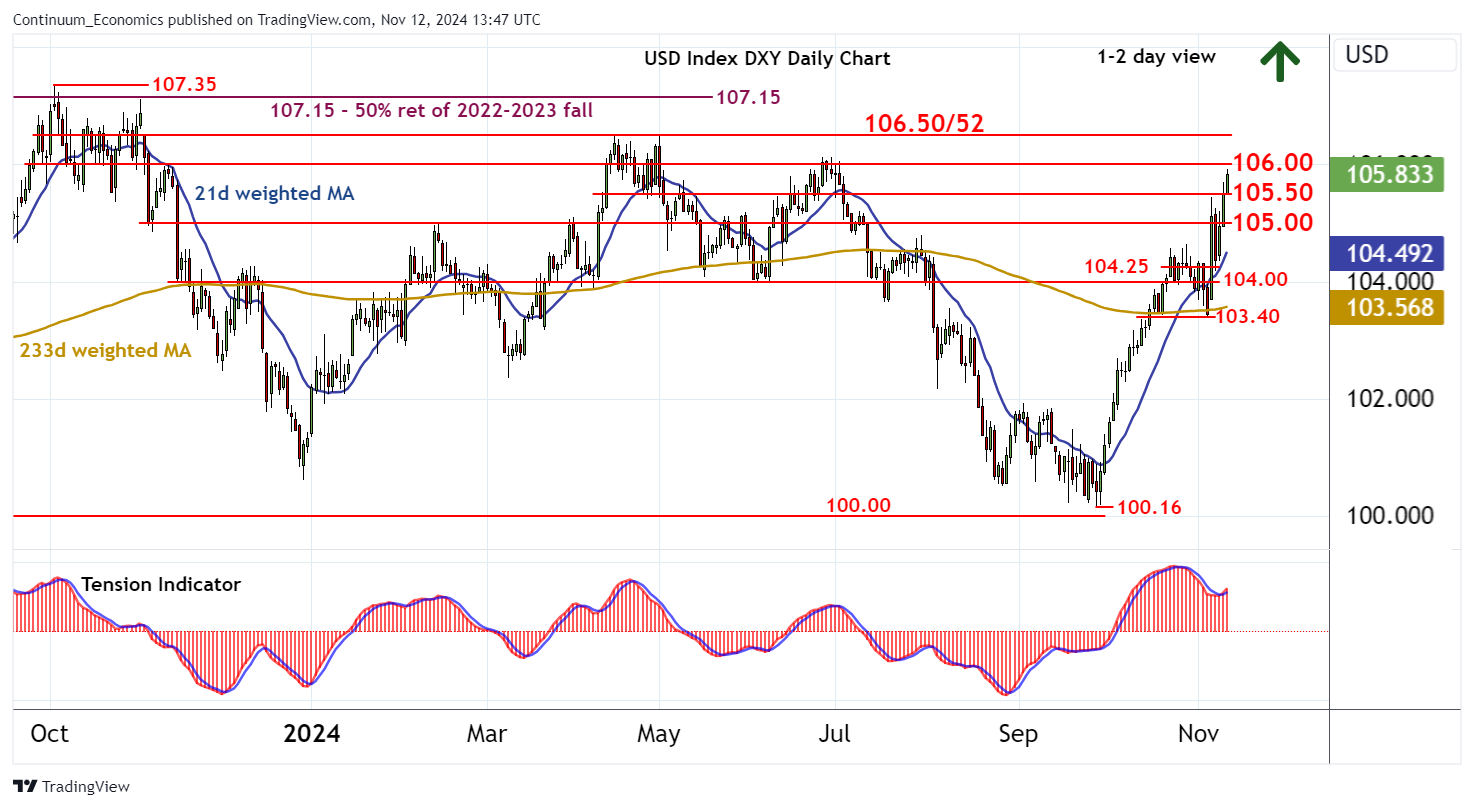
Chart USD Index DXY Update: Extending September gains

Senior Technical Strategist
1

Choppy trade has given way to fresh gains

| Levels | Imp | Comment | Levels | Imp | Comment | |||
|---|---|---|---|---|---|---|---|---|
| R4 | 107.35 | * | 3 Oct 2023 (y) high | S1 | 105.50 | * | congestion | |
| R3 | 107.15 | ** | 50% ret of 2022-2023 fall | S2 | 105.00 | ** | congestion | |
| R2 | 106.50/52 | ** | cong; 16 Apr YTD high | S3 | 104.25 | intraday break level | ||
| R1 | 106.00 | * | break level | S4 | 104.00 | * | congestion |
Asterisk denotes strength of level
13:30 GMT - Choppy trade has given way to fresh gains, with the break above 105.50 currently trading around 105.85. Daily stochastics have ticked higher and the daily Tension Indicator is also rising, highlighting room for a test of resistance at 106.00. A further break will open up strong resistance at congestion around 106.50 and the 106.52 current year high of 16 April, but flat overbought weekly stochastics could limit any initial tests in consolidation. Meanwhile, support is down to congestion around 105.00. A close beneath here, if seen, will add weight to sentiment and prompt a pullback towards support within 1014.00/25.