Published: 2024-11-20T12:43:35.000Z
Chart USD/ZAR Update: Immediate gains to remain limited

Senior Technical Strategist
-

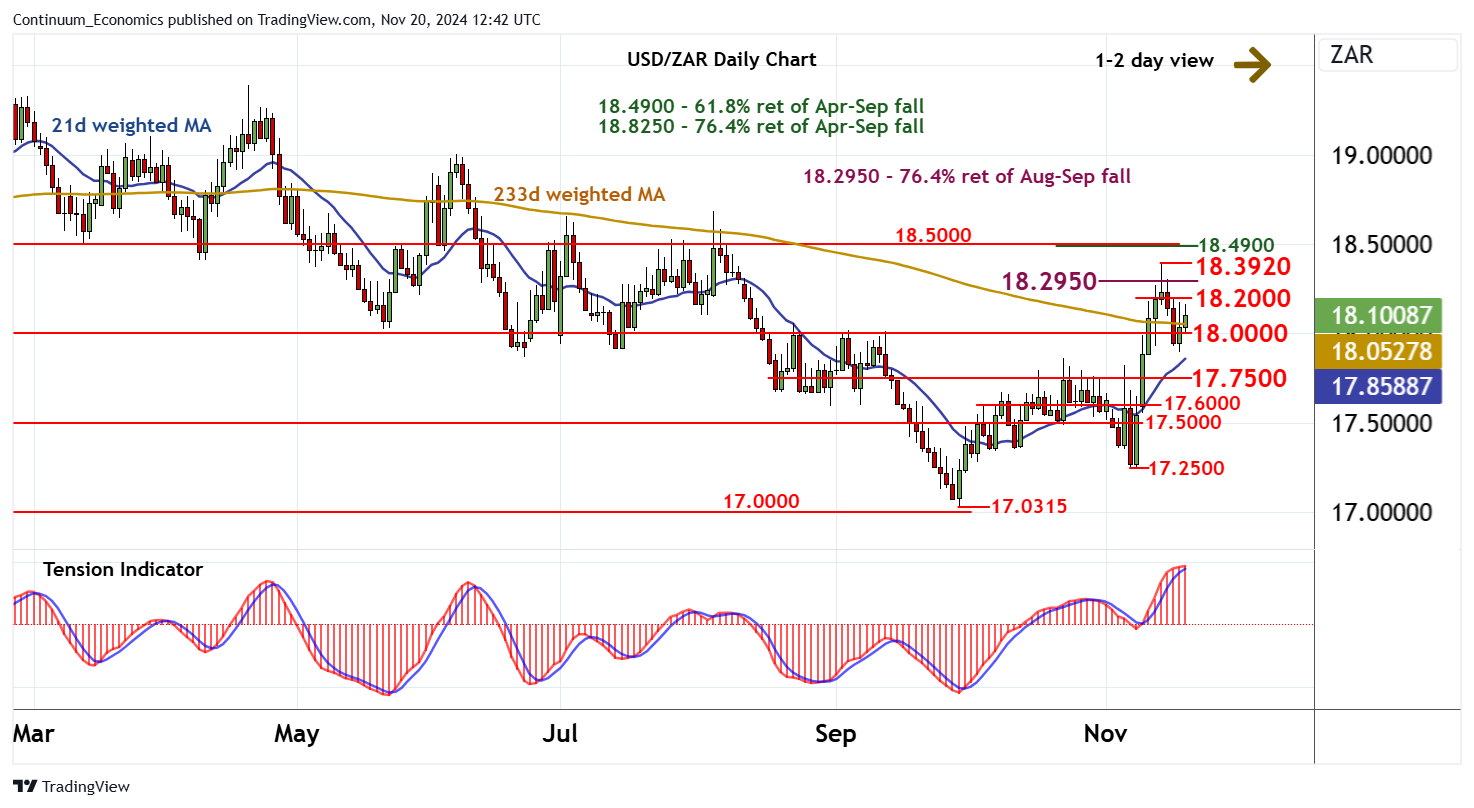
The break back above 18.0000 is extending

| Level | Comment | Level | Comment | |||||
|---|---|---|---|---|---|---|---|---|
| R4 | 18.4900 | ** | 61.8% ret of Apr-Sep fall | S1 | 18.0000 | * | congestion | |
| R3 | 18.3920 | * | 14 Nov (w) high | S2 | 17.9000~ | 19 Nov low | ||
| R2 | 18.2950 | ** | 76.4% ret of Aug-Sep fall | S3 | 17.7500 | * | congestion | |
| R1 | 18.2000 | congestion | S4 | 17.6000 | * | congestion |
Asterisk denotes strength of level
12:30 GMT - The break back above 18.0000 is extending, with prices currently trading around 18.1050. Rising intraday studies highlight potential for a test of congestion resistance at 18.2000. But negative daily stochastics and the flattening positive daily Tension Indicator, suggest any further gains should meet renewed selling interest within the 18.2950 - 18.3920 area. Broader weekly charts are rising, but a close above the 18.3920 weekly high of 14 November is needed to confirm extension of September gains towards the 18.4900 retracement and congestion around 18.5000. Meanwhile, any fresh tests below congestion support at 18.0000 should meet buying interest towards further congestion around 17.7500.