Published: 2024-10-24T07:27:37.000Z
Chart GBP/USD Update: Consolidating losses - studies under pressure

Senior Technical Strategist
4

Anticipated losses have extended to 1.2905/10

| Level | Comment | Level | Comment | |||||
|---|---|---|---|---|---|---|---|---|
| R4 | 1.3175 | * | 4 Oct high | S1 | 1.2907 | 23 Oct low | ||
| R3 | 1.3100 | * | congestion | S2 | 1.2865 | ** | 50% ret of Apr-Sep rally | |
| R2 | 1.3070 | * | 18 Oct high | S3 | 1.2800 | ** | congestion | |
| R1 | 1.3000 | ** | congestion | S4 | 1.2735 | ** | 61.8% ret of Apr-Sep rally |
Asterisk denotes strength of level
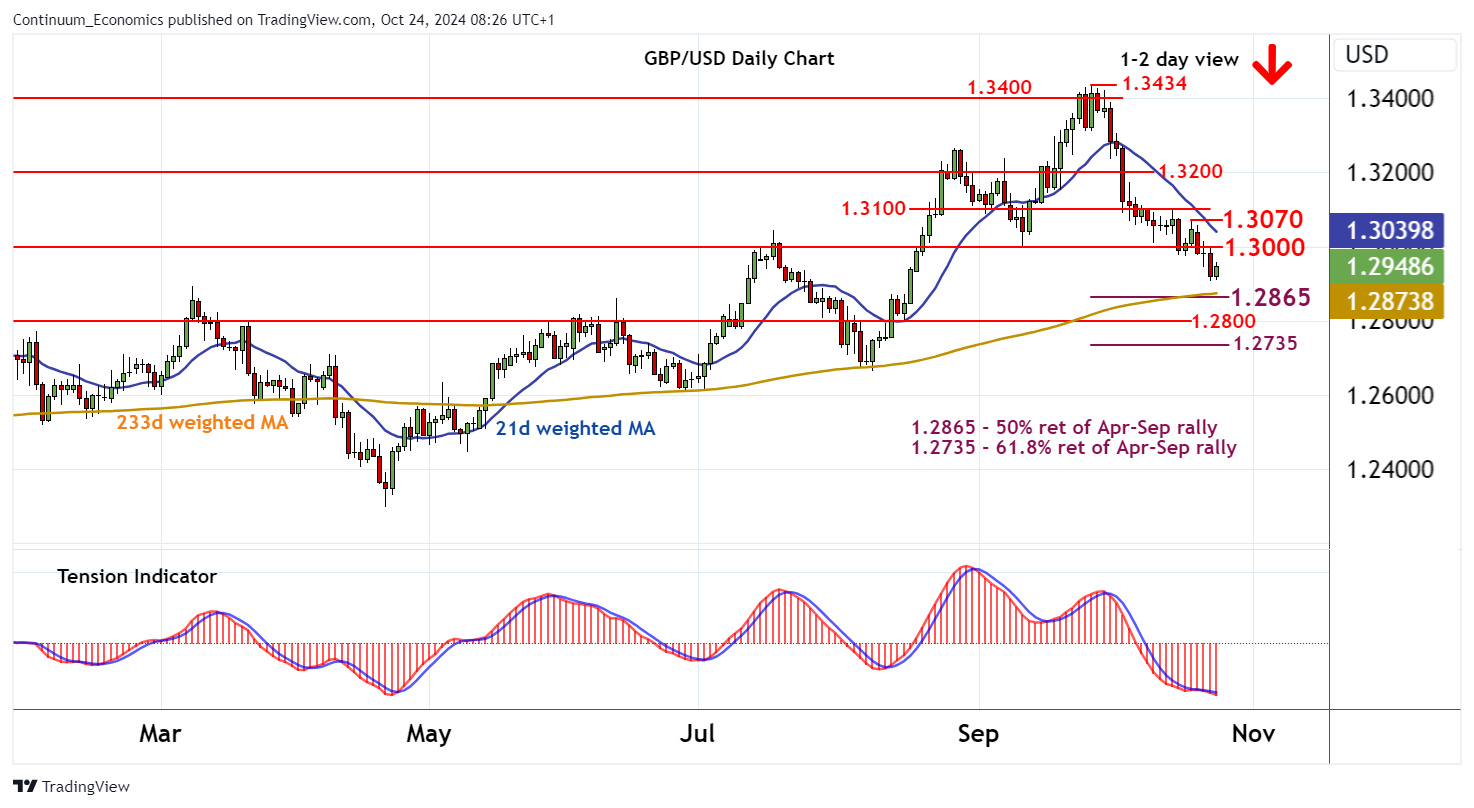
08:05 BST - Anticipated losses have extended to 1.2905/10, where unwinding oversold intraday studies and flattening oversold daily stochastics are prompting a minor bounce. The daily Tension Indicator continues to track lower, however, and broader weekly charts are also negative, highlighting a bearish tone and room for still deeper losses in the coming sessions. A break beneath here will add weight to already bearish price action and extend September losses towards the 1.2865 Fibonacci retracement. However, already oversold daily stochastics could limit any initial tests in consolidation. Meanwhile, resistance remains at congestion around 1.3000. A close above here, if seen, will turn sentiment neutral and give way to consolidation beneath congestion around 1.3100.