Published: 2024-11-06T08:30:32.000Z
Chart EUR/USD Update: Sharp fall - studies under pressure

Senior Technical Strategist
-

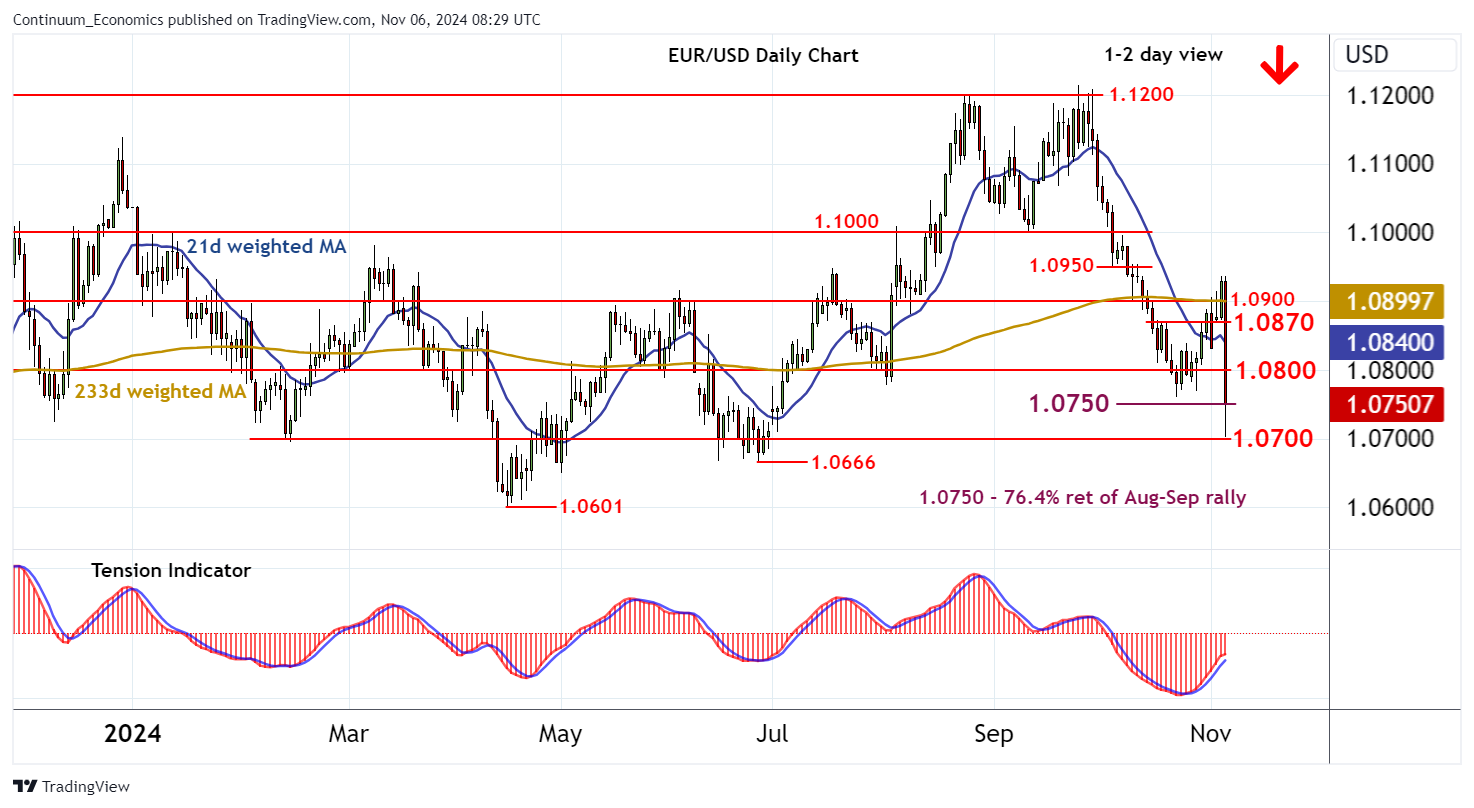
Anticipated selling interest around 1.0930 has led to a sharp fall

| Levels | Imp | Comment | Levels | Imp | Comment | |||
|---|---|---|---|---|---|---|---|---|
| R4 | 1.0950 | break level | S1 | 1.0750 | ** | 76.4% ret of Aug-Sep rally | ||
| R3 | 1.0900 | ** | break level | S2 | 1.0700 | * | congestion | |
| R2 | 1.0870 | break level | S3 | 1.0666 | ** | 26 Jun (m) low | ||
| R1 | 1.0800 | * | congestion | S4 | 1.0600/01 | ** | congestion; 16 Apr YTD low |
Asterisk denotes strength of level
08:20 GMT - Anticipated selling interest around 1.0930 has led to a sharp fall, with prices currently balanced around the 1.0750 Fibonacci retracement. The rising daily Tension Indicator is showing early signs of flattening and daily stochastics are under pressure, highlighting room for a fresh break beneath here, back to congestion support at 1.0700. Negative weekly charts point to still further losses, with a break beneath here extending September losses towards the 1.0666 monthly low of 26 June. Meanwhile, resistance is lowered to congestion around 1.0800. A close above here is needed to stabilise price action and prompt consolidation beneath the 1.0870 break level.