Published: 2024-11-13T13:14:32.000Z
Chart USD/ZAR Update: Consolidating gains - studies rising

Senior Technical Strategist
-

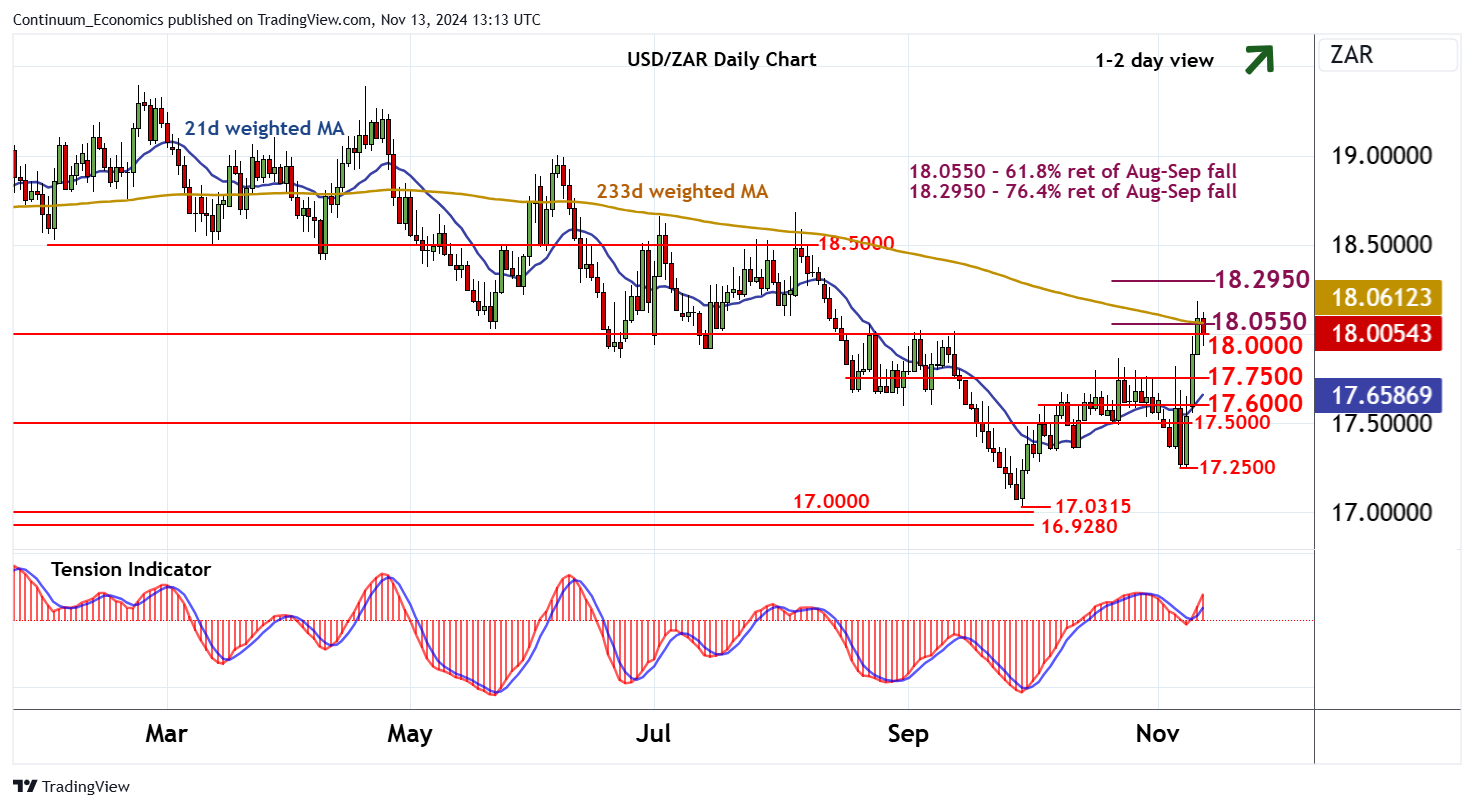
The test above the 18.0000 - 18.0500 resistance area has been pushed back from 18.1815

| Level | Comment | Level | Comment | |||||
|---|---|---|---|---|---|---|---|---|
| R4 | 18.2950 | ** | 76.4% ret of Aug-Sep fall | S1 | 17.7500 | * | congestion | |
| R3 | 18.1815 | 12 Nov high | S2 | 17.6000 | * | congestion | ||
| R2 | 18.0500 | ** | 61.8% ret of Aug-Sep fall | S3 | 17.5000 | * | break level | |
| R1 | 18.0000 | * | congestion | S4 | 17.3500 | ** | break level |
Asterisk denotes strength of level
12:50 GMT - The test above the 18.0000 - 18.0500 resistance area has been pushed back from 18.1815, as intraday studies turn down, with prices currently trading around 18.0000. A minor test lower is possible, but rising daily readings should limit scope in renewed buying interest above congestion support at 17.7500. In the coming sessions, cautious trade is expected to give way to fresh gains, with a fresh close above the 18.0500 Fibonacci retracement turning sentiment positive and extending September gains towards the 18.2950 retracement. By-then overbought daily stochastics could prompt more significant profit-taking around here.