Published: 2024-11-04T12:11:10.000Z
Chart USD/ZAR Update: Prices remain under pressure

Senior Technical Strategist
-

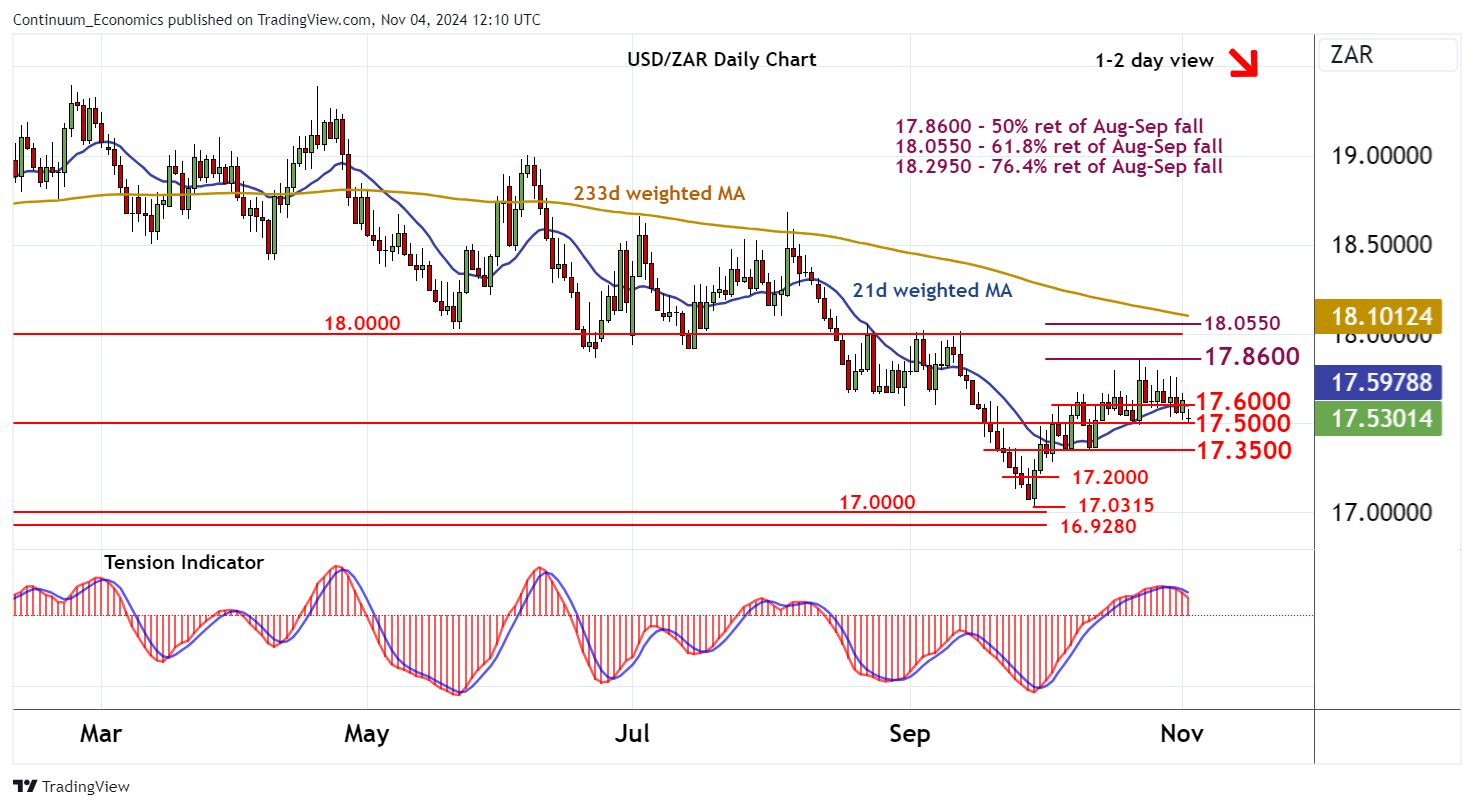
Little change, as prices extend pressure on support at the 17.5000 break level

| Level | Comment | Level | Comment | |||||
|---|---|---|---|---|---|---|---|---|
| R4 | 18.0550 | ** | 61.8% ret of Aug-Sep fall | S1 | 17.5000 | * | break level | |
| R3 | 18.0000 | * | congestion | S2 | 17.3500 | intraday break level | ||
| R2 | 17.8600 | ** | 50% ret of Aug-Sep fall | S3 | 17.2000 | intraday pivot | ||
| R1 | 17.6000 | * | minor congestion | S4 | 17.0315 | ** | 30 Sep YTD low |
Asterisk denotes strength of level
12:00 GMT - Little change, as prices extend pressure on support at the 17.5000 break level. Daily readings continue to fall and rising weekly stochastics are showing signs of flattening, highlighting a deterioration in sentiment and room for further losses in the coming sessions. A break beneath 17.5000 will open up 17.3500, where the positive weekly Tension Indicator should prompt renewed buying interest. Meanwhile, a close back above 17.6000 will turn sentiment neutral. But a further close above the 17.8600 Fibonacci retracement is needed to turn sentiment positive and extend September gains towards resistance within the 18.0000 - 18.0550 area.