Published: 2024-11-06T08:41:49.000Z
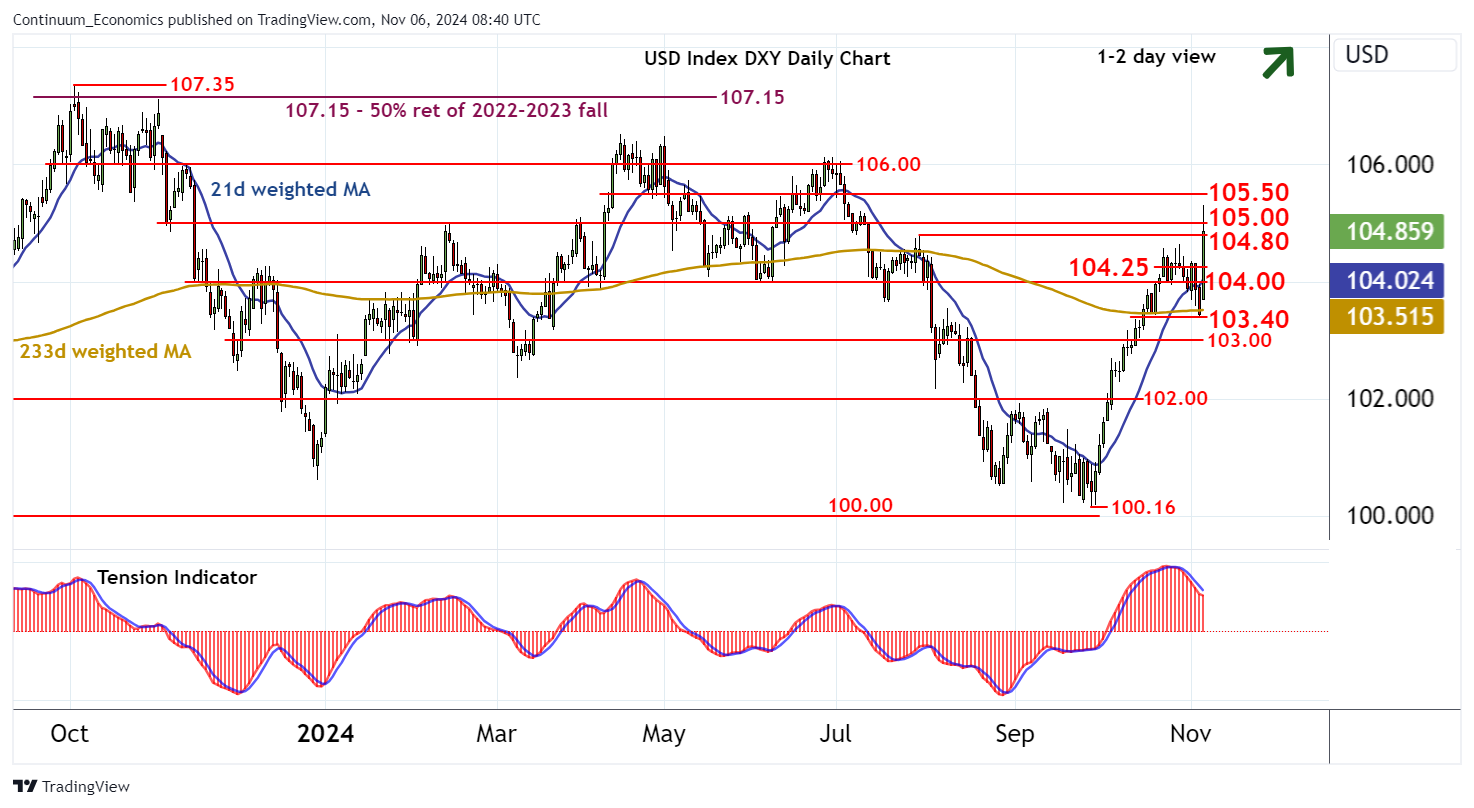
Chart USD Index DXY Update: Sharp reversal - resistance at 105.50

Senior Technical Strategist
-

The test of support at the 103.40 break level has given way to a sharp bounce to 105.30~

| Levels | Imp | Comment | Levels | Imp | Comment | |||
|---|---|---|---|---|---|---|---|---|
| R4 | 105.50 | * | congestion | S1 | 104.25 | intraday break level | ||
| R3 | 105.30~ | current day high | S2 | 104.00 | * | congestion | ||
| R2 | 105.00 | ** | congestion | S3 | 103.40 | break level | ||
| R1 | 104.80 | ** | 30 Jul (m) high | S4 | 103.00 | ** | congestion |
Asterisk denotes strength of level
08:30 GMT - The test of support at the 103.40 break level has given way to a sharp bounce to 105.30~, before settling into choppy trade within resistance at the 104.80/00 area. The bearish daily Tension Indicator is showing early signs of flattening, and oversold daily stochastics are ticking higher, suggesting room for still further strength. But flat overbought weekly stochastics are expected to prompt fresh selling interest towards congestion resistance at 105.50. Meanwhile, support is raised to 104.25 and extends to 104.00. A close beneath here here would turn sentiment neutral and prompt consolidation above 103.40.