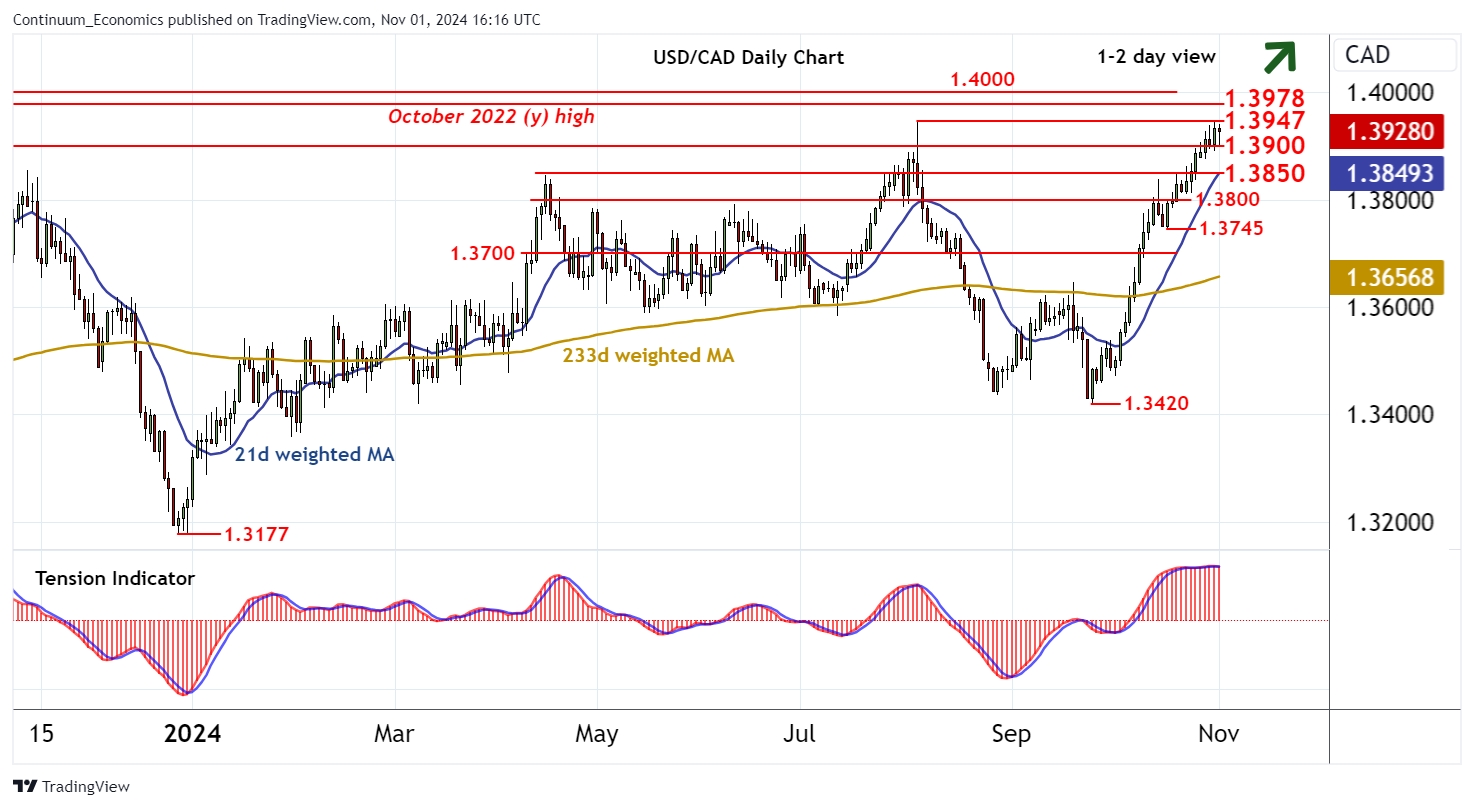
Chart USD/CAD Update: Balanced beneath current year highs

Still little change, as prices extend choppy trade beneath strong resistance at the 1.3947 current year high of 5 August

| Levels | Imp | Comment | Levels | Imp | Comment | |||
|---|---|---|---|---|---|---|---|---|
| R4 | 1.4040 | ** | 76.4% ret of 2020-2021 fall | S1 | 1.3900 | break level | ||
| R3 | 1.4000 | figure | S2 | 1.3850 | break level | |||
| R2 | 1.3978 | ** | October 2022 (y) high | S3 | 1.3800 | ** | congestion | |
| R1 | 1.3947 | 5 Aug YTD high | S4 | 1.3745 | * | 17 Oct (w) low |
Asterisk denotes strength of level
16:10 GMT - Still little change, as prices extend choppy trade beneath strong resistance at the 1.3947 current year high of 5 August. Overbought daily stochastics are turning down and the positive daily Tension Indicator is flat, suggesting fresh consolidation beneath here, before rising weekly charts prompt a break. A close above here will improve sentiment and open up critical multi-month resistance at the 1.3978 year high of October 2022. Still higher is the 1.4040 Fibonacci retracement, but already overbought weekly stochastics could prompt profit-taking pressure towards here. Meanwhile, support remains at the 1.3900 break level. A close beneath here would turn sentiment neutral and prompt fresh consolidation above the 1.3850 break level.