Published: 2024-11-14T14:03:11.000Z
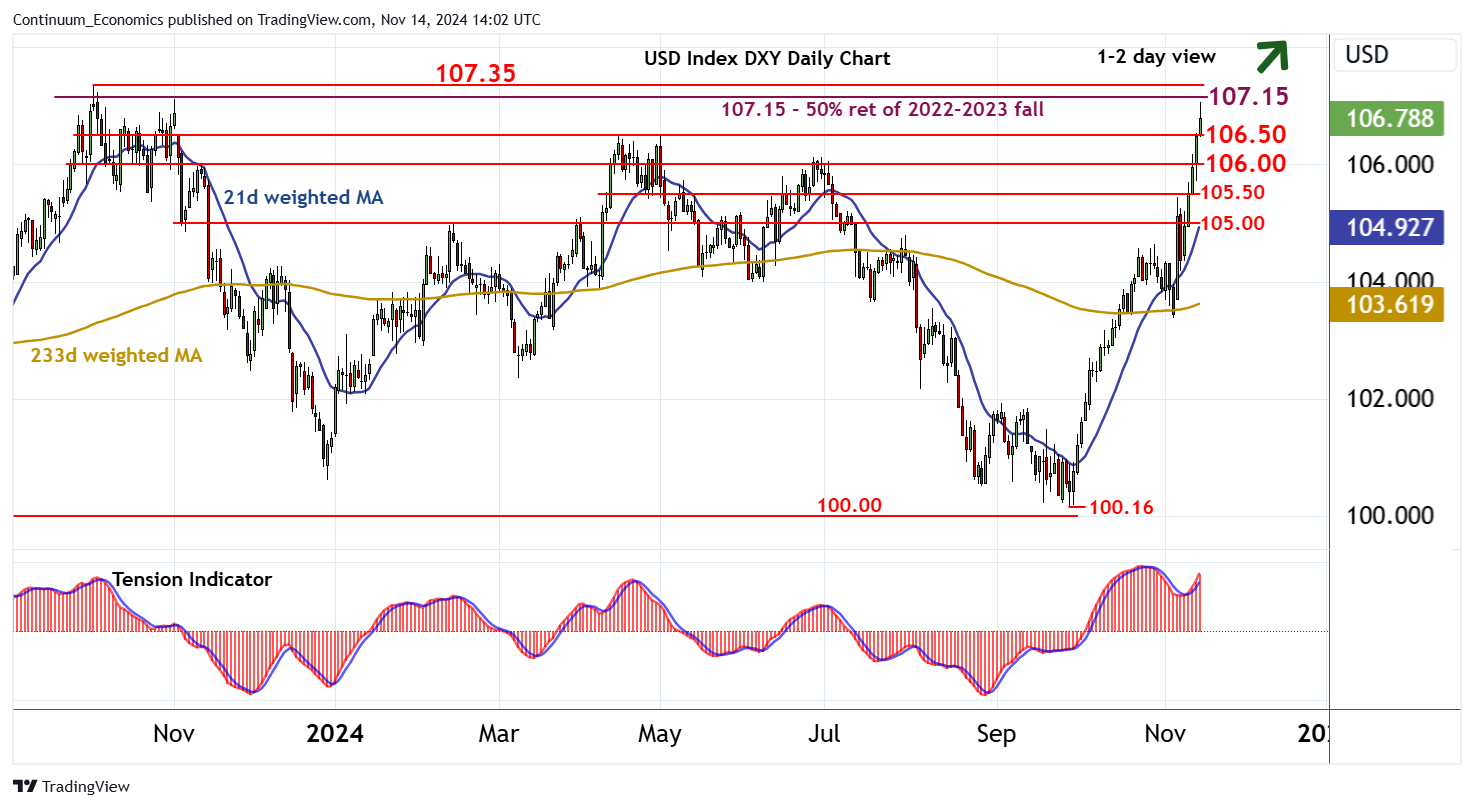
Chart USD Index DXY Update: Critical resistance at 107.15/35

Senior Technical Strategist
-

Intraday consolidation has given way to fresh gains

| Levels | Imp | Comment | Levels | Imp | Comment | |||
|---|---|---|---|---|---|---|---|---|
| R4 | 108.00 | * | mid-Nov 22 (w) high | S1 | 106.50 | ** | congestion | |
| R3 | 107.35 | * | 3 Oct 2023 (y) high | S2 | 106.00 | * | break level | |
| R2 | 107.15 | ** | 50% ret of 2022-2023 fall | S3 | 105.50 | * | congestion | |
| R1 | 107.06 | fresh 2024 year high | S4 | 105.00 | ** | congestion |
Asterisk denotes strength of level
13:35 GMT - Intraday consolidation has given way to fresh gains, with the break above 106.50 posting a fresh 2024 year high around 107.06. Overbought intraday studies are prompting short-term consolidation beneath here, but daily readings continue to rise, pointing to room for extension of September gains towards resistance at the 107.15 Fibonacci retracement. Just higher is critical resistance at the 107.35 year high of 3 October. Flat overbought weekly stochastics could limit any initial tests of this area in consolidation, before the rising weekly Tension Indicator and improving longer-term charts prompt a break. Meanwhile, a close back below 106.50 would add weight to sentiment and put focus on 106.00.