Published: 2024-11-15T08:34:00.000Z
Chart GBP/USD Update: Consolidating losses, but studies remain under pressure

Senior Technical Strategist
2

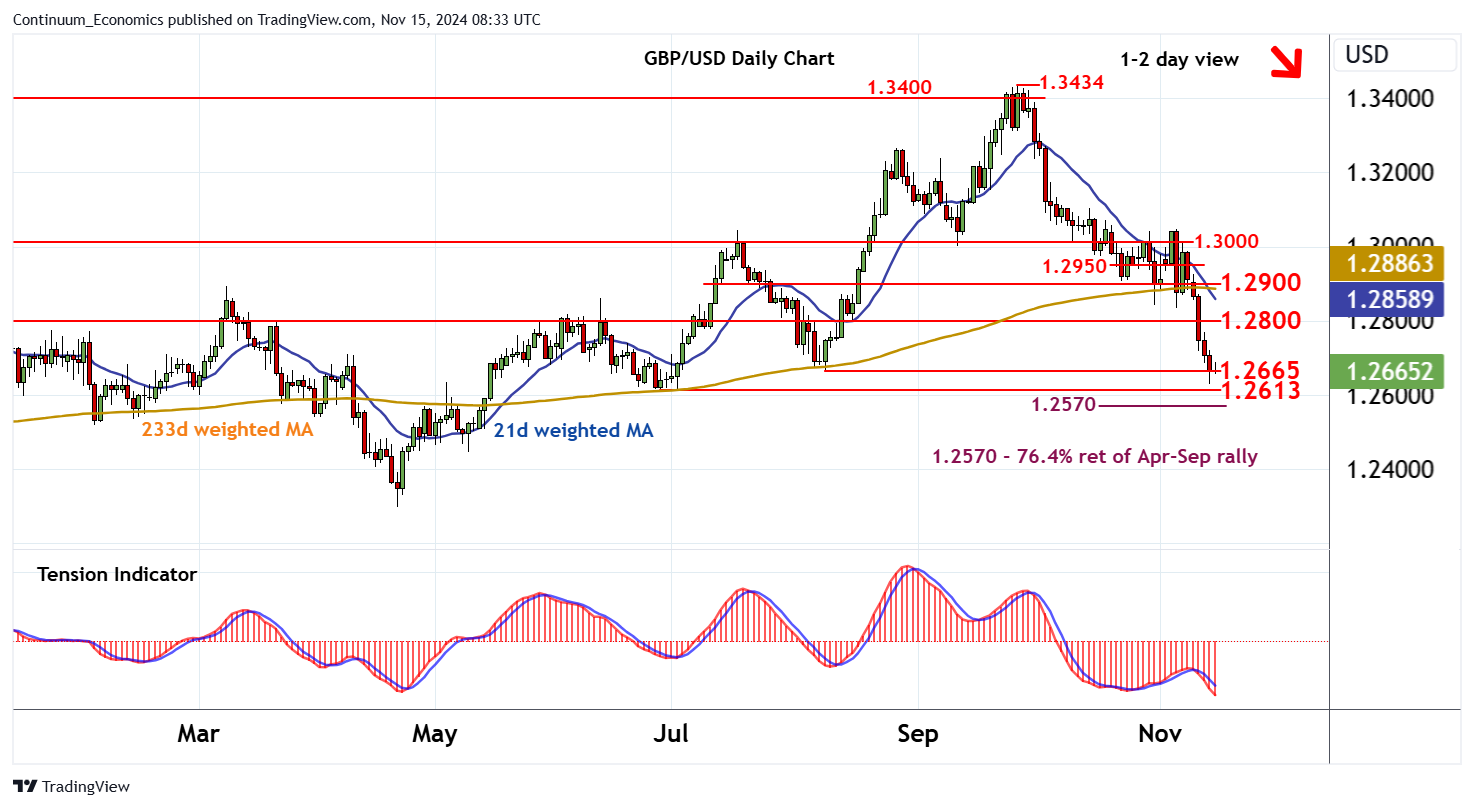
The anticipated break below the 1.2665 monthly low of 8 August has bounced smartly from 1.2630

| Level | Comment | Level | Comment | |||||
|---|---|---|---|---|---|---|---|---|
| R4 | 1.2950 | * | break level | S1 | 1.2665 | * | 8 Aug (m) low | |
| R3 | 1.2900 | * | congestion | S2 | 1.2613 | * | 27 Jun (m) low | |
| R2 | 1.2800 | * | congestion | S3 | 1.2570 | ** | 76.4% ret of Apr-Sep rally | |
| R1 | 1.2768 | 13 Nov high | S4 | 1.2500 | ** | congestion |
Asterisk denotes strength of level
08:10 GMT - The anticipated break below the 1.2665 monthly low of 8 August has bounced smartly from 1.2630, as oversold intraday studies unwind and oversold daily stochastics flatten, with prices currently balanced around 1.2665. However, the daily Tension Indicator is falling and broader weekly charts remain under pressure, highlighting room for further losses in the coming sessions. A fresh break below 1.2665 will extend September losses towards the 1.2613 monthly low of 27 June. But flattening oversold weekly stochastics are expected to limit any deeper reactions in short-covering towards the 1.2570 Fibonacci retracement. Meanwhile, resistance remains at congestion around 1.2800. A close above here, if seen, will turn sentiment neutral and prompt consolidation beneath further congestion around 1.2900.