Published: 2024-11-15T08:54:22.000Z
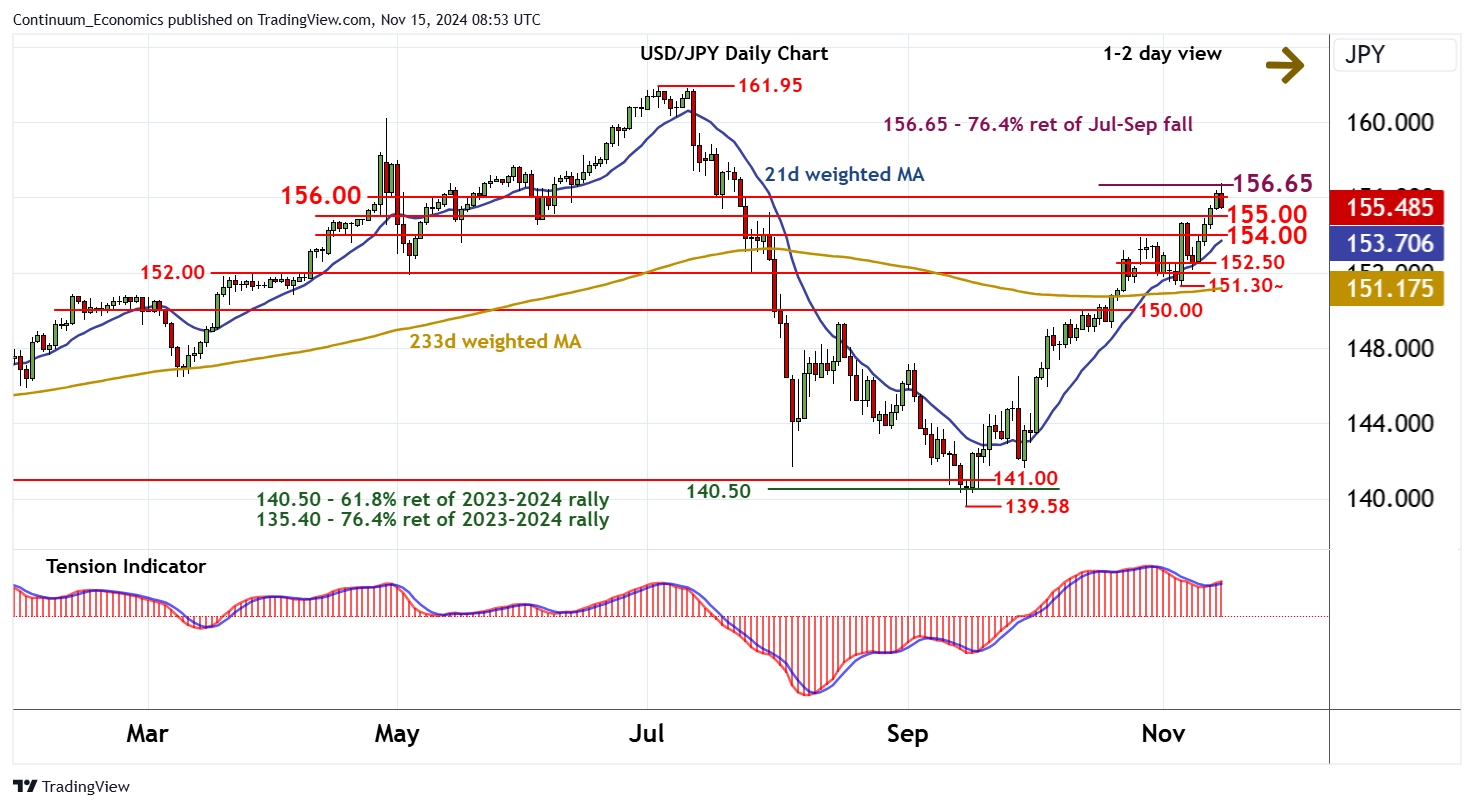
Chart USD/JPY Update: Meeting selling pressure at the 156.65 Fibonacci retracement

Senior Technical Strategist
2

September gains have extended beyond 156.00 to reach strong resistance at the 156.65 Fibonacci retracement

| Levels | Imp | Comment | Levels | Imp | Comment | |||
|---|---|---|---|---|---|---|---|---|
| R4 | 157.86 | 19 Jul high | S1 | 155.00 | * | congestion | ||
| R3 | 157.00 | * | break level | S2 | 154.00 | * | break level | |
| R2 | 156.65 | ** | 76.4% ret of Jul-Sep fall | S3 | 152.50 | * | break level | |
| R1 | 156.00 | * | congestion | S4 | 152.00 | ** | break level |
Asterisk denotes strength of level
08:45 GMT - September gains have extended beyond 156.00 to reach strong resistance at the 156.65 Fibonacci retracement, where profit-taking has prompted a pullback and a break back below 156.00. Falling intraday studies highlight potential for a move down to congestion support at 155.00. A break will open up support at the 154.00 break level, but the positive daily Tension Indicator and rising weekly charts could limit any initial tests in consolidation. A break, however, will add further weight to sentiment and prompt a swift fall towards 152.50. Meanwhile, a close above 156.65 is needed to turn price action positive once again and extend September gains towards 157.00.