The Endpoint Problem: US Asset Prices, Investment and the Current Cycle
· Asset Price Index (API) framework suggests the US gap is elevated and, on some constructs, has moved into top-decile territory.
· The question is whether prices, capex and financing conditions are beginning to reinforce the same cyclical risk-accumulation dynamics.
· The closest comparison is late 1998 rather than the 2000 peak: cyclically strained and over-accelerating, if not yet exhausted.
· More an event risk marker than recession forecast: the API captures when asset-price/investment configurations have entered territory where drawdowns and macro-financial event risks have historically been higher over a two-year horizon.
Asset prices, balance-sheet conditions and investment behaviour become macro-relevant when they begin to reinforce one another, building short-term excesses, misallocations, cross-dependencies and leverage. A broad BIS-style asset-price index (API) combines major asset classes (equities, residential, commercial real estate prices) into one weighted index. It is useful, when analysed in broader context, because it abstracts from all the individual details and stories and asks more abstractly whether the overall configuration has moved into a historically stretched state, typical of heightened financial and macro event risk.
That matters in the current U.S. cycle because it can be hard to step back and stock take amid the overlapping sources of uncertainty: AI, market concentration, unprecedented counter-cyclical fiscal support, capex, and the persistence of risk rallies. The API framework asks a more specific question: whether those forces have started to form a self-reinforcing asset-price/investment regime where the dynamic builds cyclical instability, regardless of the validity of the long-term end destination.
This question is approached in three parts. The API ‘gap’ measures whether the broad asset-price state, as divergence from trend, has moved into the upper tail of its own history. The investment and financing checks ask whether that state is being echoed through the real-economy and balance-sheet channels. The historical episode snapshot then asks what has tended to follow when similar upper-tail states have appeared before. The approach is more of a high-level state risk framework than a valuation approach or universal recession model.
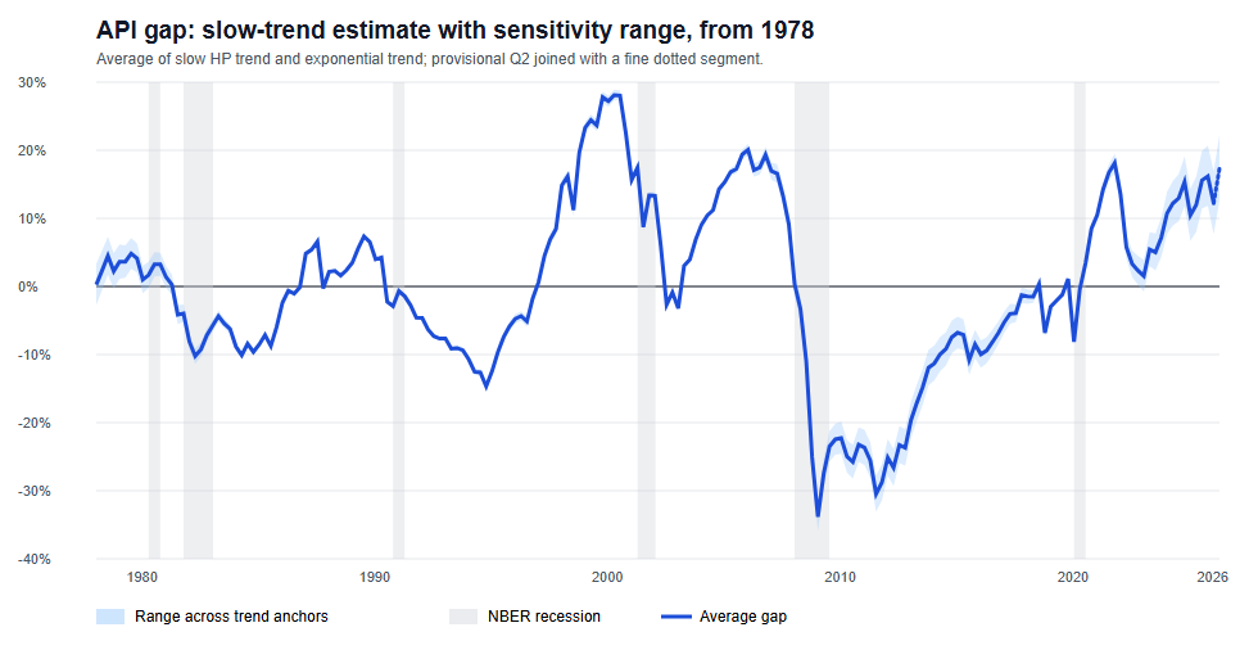
Figure 1: A “BIS-style” U.S. Asset Price Gap, on different trend assumptions
Source: CE, Datastream, broadly based on the BIS’ API concept and approach
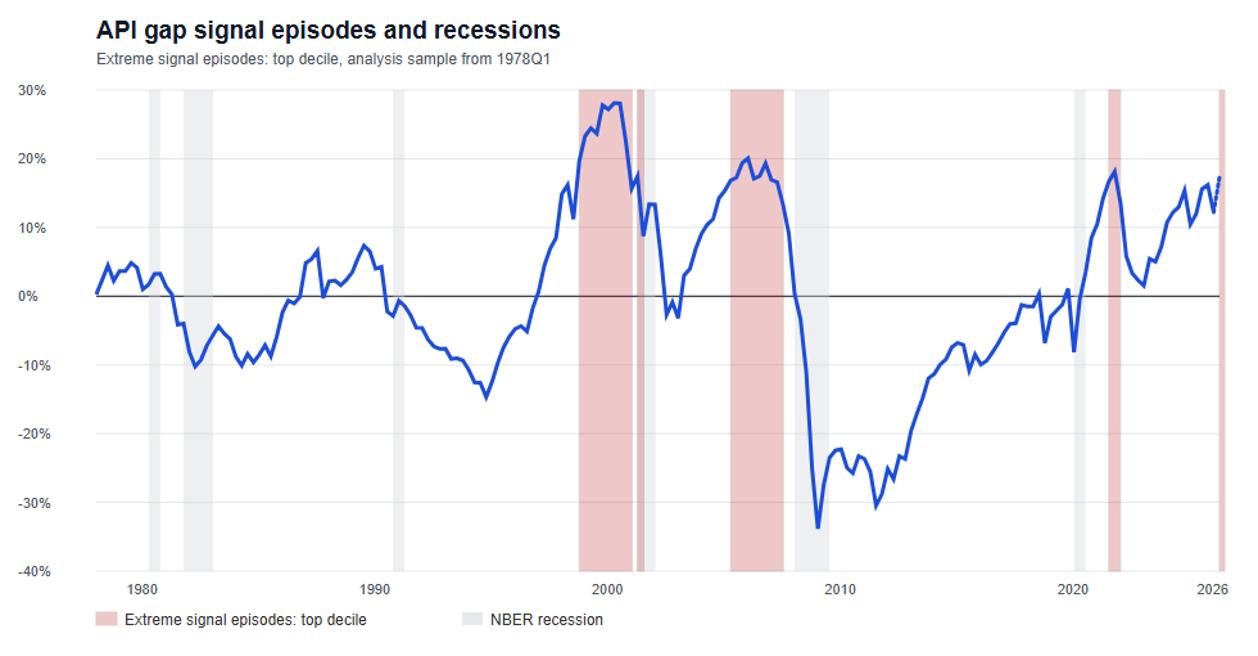
On a pure Hodrick Prescott (HP) filter basis, the current gap to trend is high (>10%) but not yet extreme. That can tend to skew to potential real time understatement however when the trend over-adapts. On the preferred more hedged approach, which combines the HP trend with an exponential version, the provisional U.S. Q2 gap has moved into top-decile territory (if still well short of the brief hyperbolic dot-com ‘blow off top’). The point is not the exact method-dependent number, it’s more the broad framing that the readings are already in elevated territory.
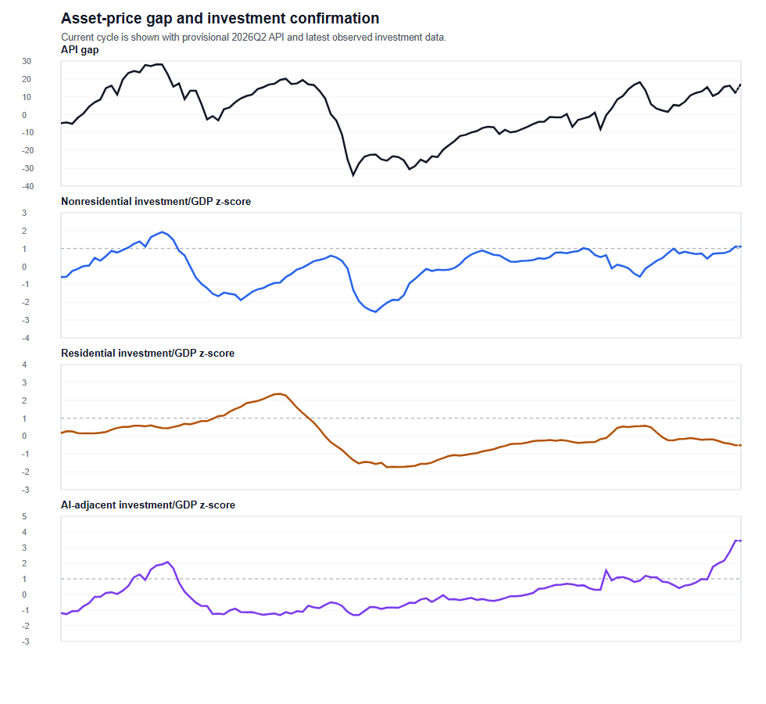
Read alongside investment Z-score type comparisons (divergences from norm), the current signal has recognisable finance-macro nexus risk features. The historic episodes were compounded through different component channels: housing investment into 2008, equity and corporate investment around 2000, and a more narrowly focused non-residential and AI-adjacent acceleration today. Credit is harder to pin down in this cycle, given the move toward shadow banking, private credit and other less transparent channels, although some visible excesses are evident in, for instance, very extended high margin debt.
Figure 2: U.S. Asset-investment cycle events from the late 1990s
Source: CE, Datastream
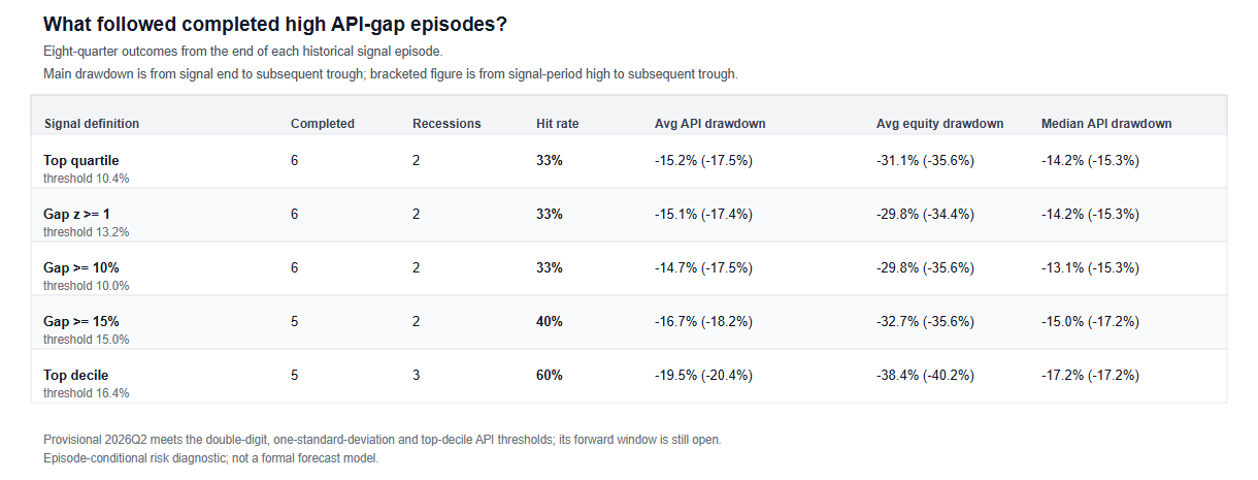
High API-gap episodes are not intended to be clean recession forecasts. The sample is too small, and not every recession is an asset-price-cycle recession. They are better read as stress-event markers: periods in which the asset-price/investment configuration has already moved into an over-accelerating zone - where exposures and risks are concentrated, leverage is more likely to matter, accelerations are more likely to have created misallocations, risk builds, free cash flow disappears and cash balances reduced. And subsequent drawdowns or recession risk have been higher probability over the following two to three years.
Figure 3: Illustrative event-risk comparisons (at completion of high gap episodes)
Source: CE, Datastream
The closest parallel is therefore not "today is 2000" in a naive company-by-company sense. This approach deliberately abstracts from company-level valuation quality because, in these cycles, some of the variables usually treated as validating inputs are also outputs of the cycle itself. That is the critical distinction between exogenous fundamentals and endogenous reinforcement. Earnings expectations, capex plans, funding conditions and risk appetite are not cleanly independent once asset prices and investment behaviour follow themes, especially innovation shock driven paths.
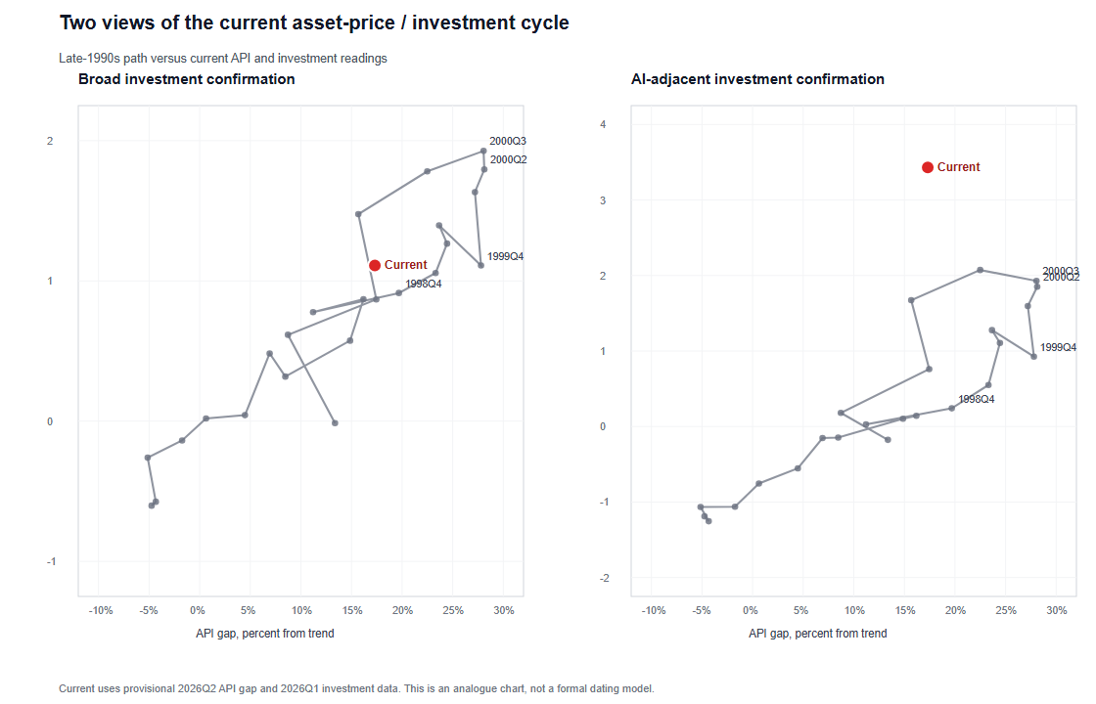
On that reading, the current cycle looks cyclically strained, but not necessarily mechanically exhausted. Against the late-1990s path, the current API/investment combination sits closer to a late-1998-style phase than to the final 2000 peak.
Figure 4: Illustrative comparison of asset-investment clock vs late 1990s
Source: CE, Datastream
Perhaps the comparison that is most advanced and late on the ‘clock’ comparison is the narrow AI-adjacent investment scale. A St. Louis Fed paper a few months ago similarly noted that AI-related investment, at 0.97pp contribution to real GDP in the first three quarters of 2025, was already above the comparable dot.com contribution in 2000. Looking at the more recent data since, it has broadly held that kind of annualised contribution pace. Now part of this current investment is a non-residential rotation/substitution story, capping overall investment acceleration. Moreover, there are already heavy ongoing investment commitments for the next year plus. With the current innovation cycle more capex intensive than dot.com it does make sense that this cycle could scale comparatively, in size and duration.
It’s intuitive plausible then that some of the excesses currently built into guidance and investment pipelines may still need to unfold before exhaustion and fragilities from the acceleration fully materialise.
The “endpoint problem” of the title is therefore both statistical and conceptual. Statistically, trend estimates at the end of the sample are notoriously the least reliable because there are no future observations to anchor the split between trend and cycle (one sided vs two sided). But conceptually too, that uncertainty is the question itself: how much of the current asset-price and investment acceleration should be treated as durable trend (current and not just future), and how much is part of the cycle? If the current impulse is absorbed smoothly and accident free into trend, the gap will look less extreme with hindsight. If bust dynamics enter the sample earlier in line with similar past experiences of innovation shocks, a trend that adapted too quickly will have understated the imbalance in real time, and the estimated gap will widen retrospectively as the drawdown unfolds.
Figure 5: Small sample (infrequent event) history of top-tier gaps and business cycle
Source: CE, Datastream
To be clear then, asset-price cycles do not require the long-run story to be wrong; they just require the short-run structure to have accumulated cyclical excesses and vulnerability in the surge. In that short-term overshoot space, jolts from any source, internal or external to the narrative, can see momentum reverse, financing and financial conditions tighten abruptly, and previously reinforcing dynamics become destabilising.
The question then, when abstracting from details that could mislead as much as inform, is a narrow one: whether conditions around the technology shock are entering the upper tail of past asset-price/investment cycles. On the current evidence, the argument is ‘probably’. The cycle has moved into the region where fundamentals and reinforcement are harder to separate, the endpoint is intrinsically uncertain, and event risk looks likely to scale substantially over the next year if the current path is maintained.