The 18yr Housing Cycle: Bent, Broken, or Still on Track
* Housing has reached the end of its classic 18yr cycle. Did Covid bring the peak, and part of the bust, forward? Or merely muddy a cycle that is still running into familiar inflation-rates pressure and financial cycle dangers on cue?
* Performances vary globally. Resilient cash prices disguise a real correction in UK, Some countries off steeply and some near the peaks. Some real valuations are less stretched although the real economy impact of higher financing costs remain all the same
* The starting point looks very different from 2007. UK and US household leverage is substantially lower; Canada and Australia divergent
* Housing may be secondary rather than primary to this financial cycle. Employment, AI, geopolitics of supply dominate the outlook.
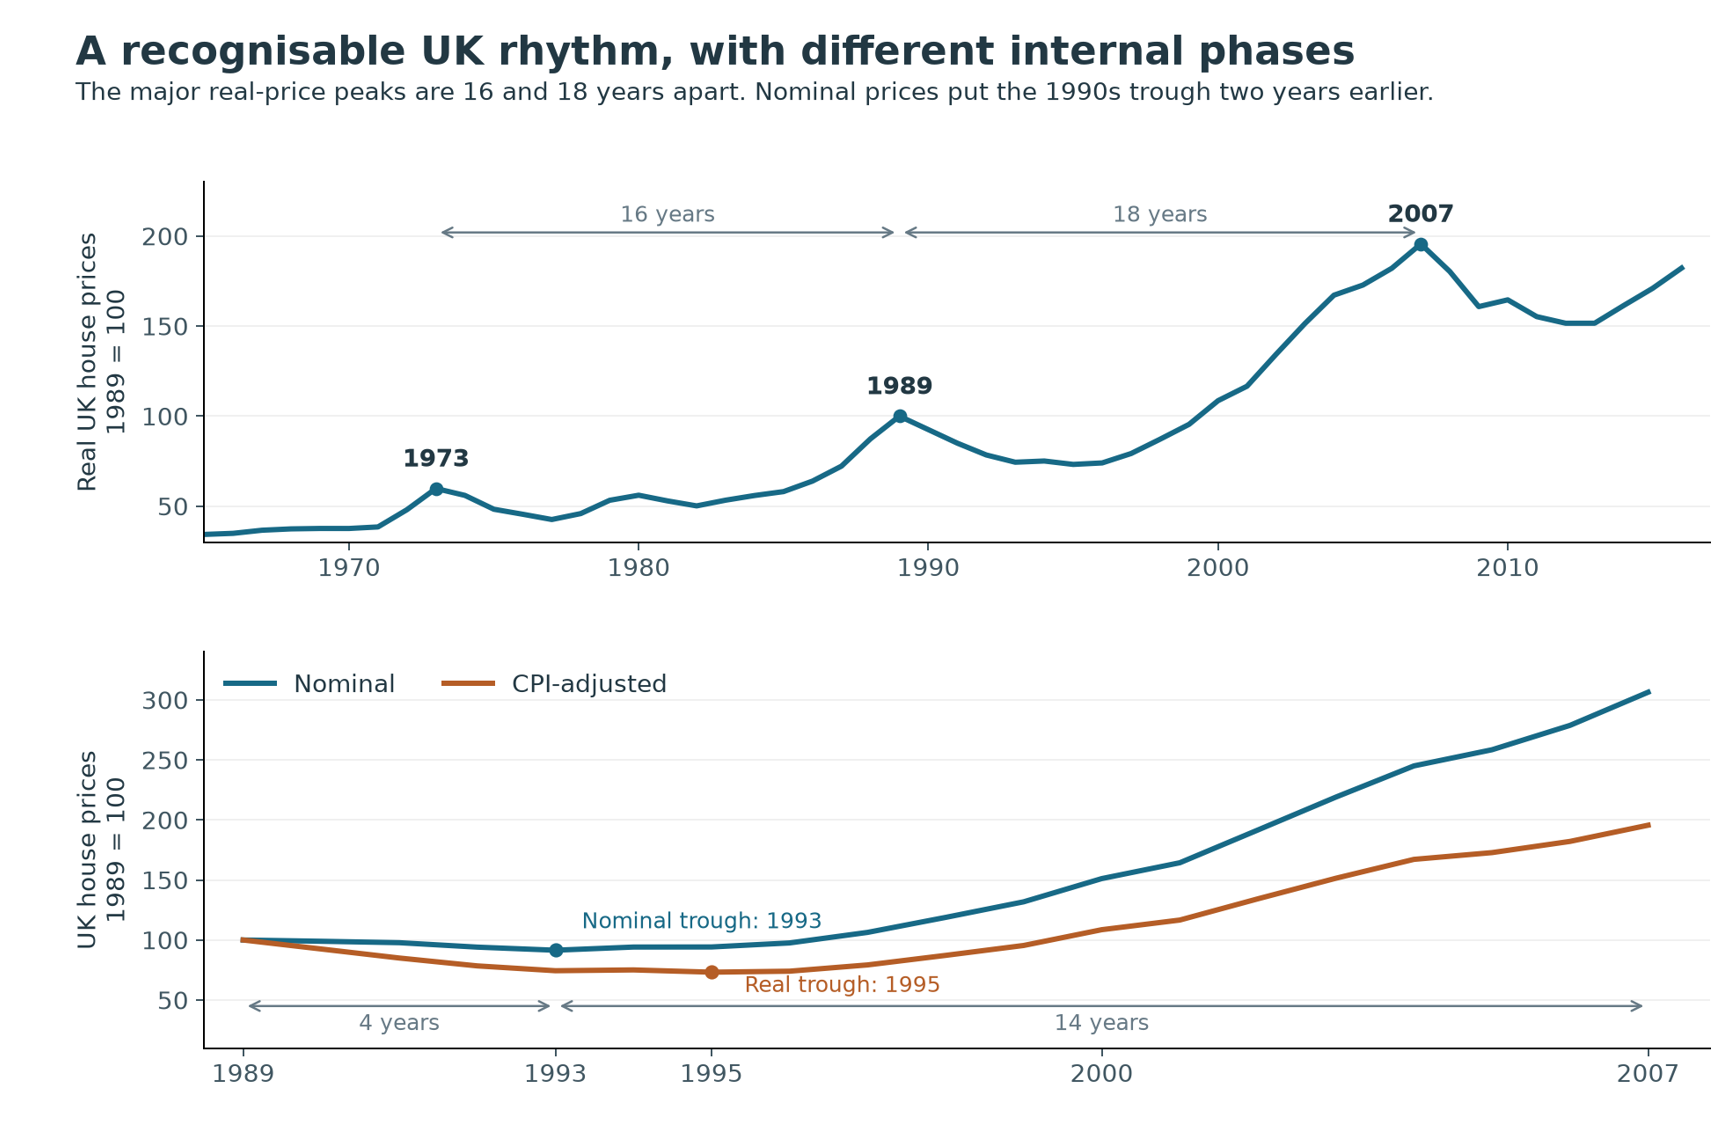
The roughly 18-year land-housing cycle, championed for decades by the alternative economist Fred Harrison, has proved pretty seductive. The stylised pattern consists of a first seven-year growth phase, followed by a mid-cycle scare, or limited stall, then a further seven-year upswing that gathers speculative momentum, before ending in a bubble top and a four-year downturn or hangover. The timings can stretch and drift a little. But the recurrence of major turning points has been striking in the UK, with some supporting examples in the US, if considerably more variation elsewhere.
Figure 1: Past UK house price cycles were broadly conforming
Source: BoE data; CE
Proponents trace versions of this pattern back to the nineteenth century, no doubt with a degree of poetic licence, when successive speculative lightning rods became enmeshed with land booms.
More concretely in the post-war era, the Anglo cycles have continued to offer a degree of apparent predictability. On Harrison’s schema, the mid-1950s liberalisation of building controls is taken as a UK reset, then peaks come in 1972–73, 1989–90 and 2007–08. That in theory pegs this year as the peak and a downturn through to 2028.
This cycle, however, has been significantly bent out of shape, leaving a market much harder to read. The Covid-19 crisis acted less like a conventional mid-cycle interruption and more as a manic accelerant. Policy responses and behavioural shifts were so extreme that, rather than the usual lull and subsequent archetypical acceleration into 2026, the cycle’s price surge appears to have been effectively borrowed forward, driven by liquidity excesses, windfall payments and the pandemic-era shift in housing preferences.
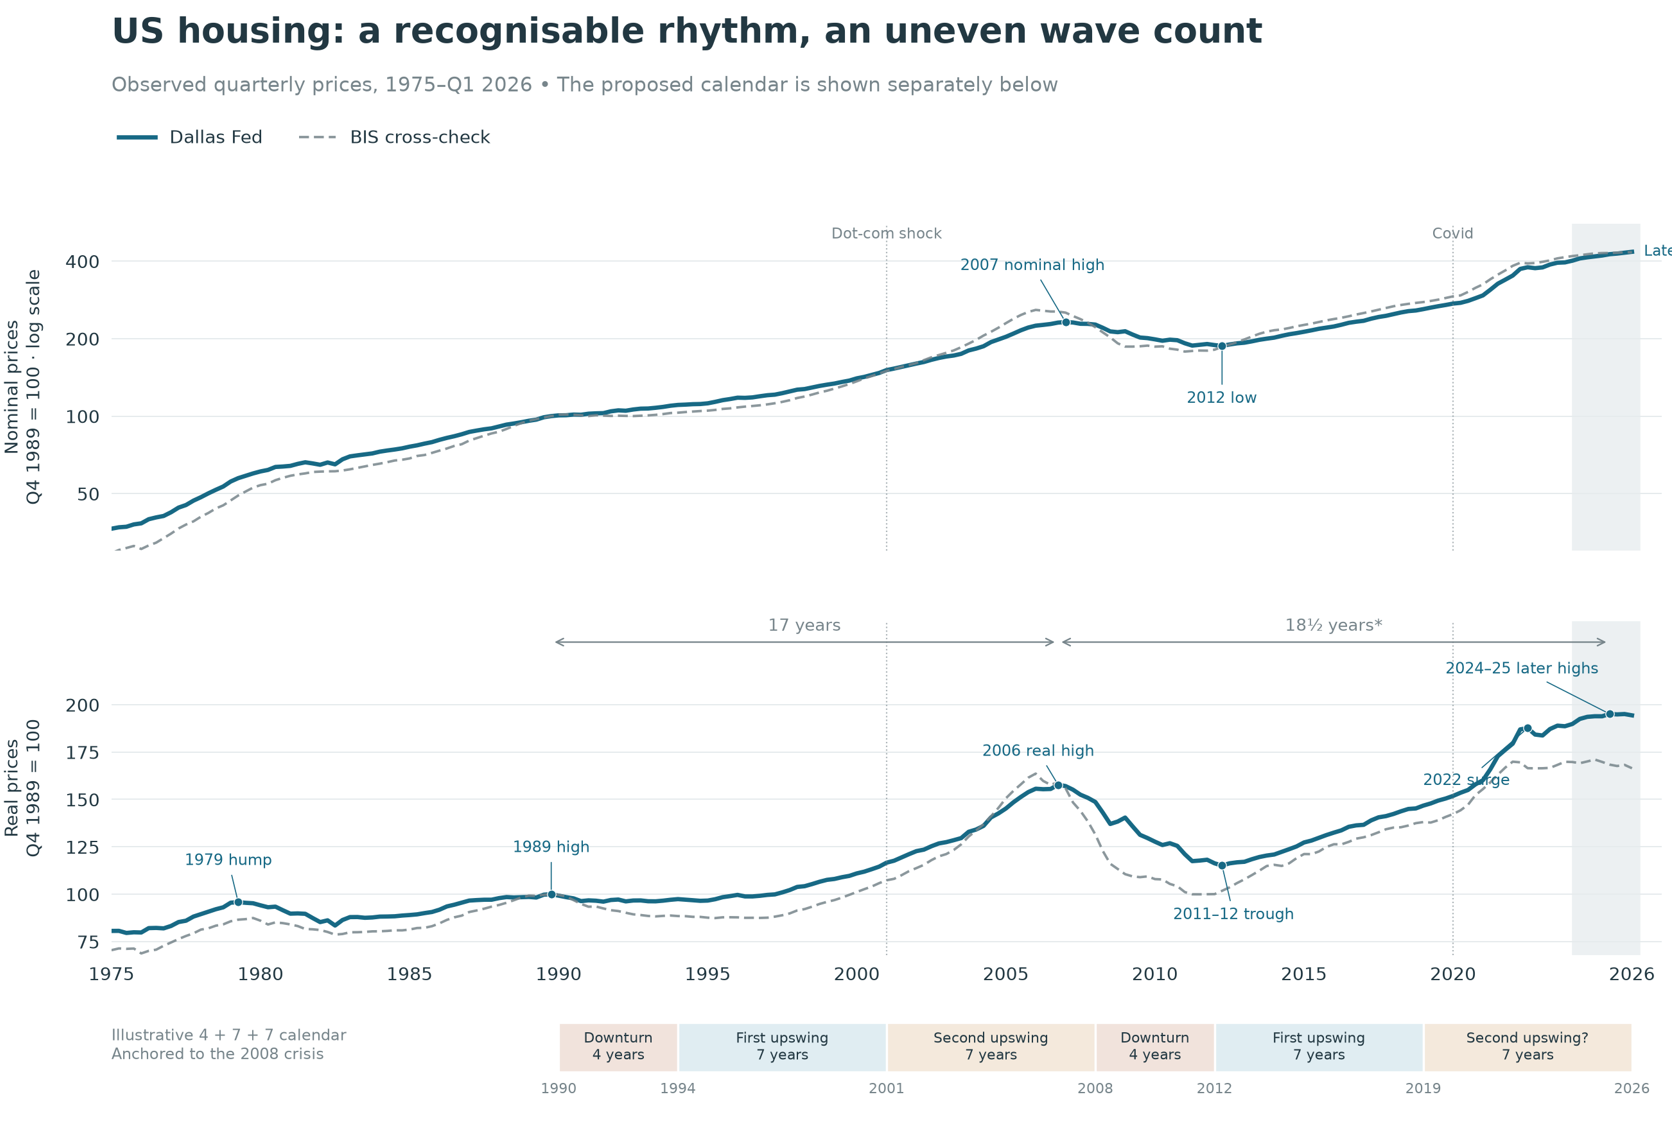
Chart 2: US cycle bent, broken, or on track this time?
Source: Dallas Fed and BIS data; CE
Globally, the setbacks that followed were substantial in several countries. The UK has largely regained its earlier cash-price highs, with inflation doing much of the real corrective work. The US has moved further and by Q1 2026, prices were around 15% above their 2022 high nominally and 4% above it in real terms in the Dallas Fed series. The US may still fit the older rhythm more closely, to a degree: recovery from the 2011–12 lows, an interruption around 2018–20, then a second upswing whose strongest surge came early. Covid may have plausibly brought forward the final acceleration, departing from the usual speculative pacing, without bringing forward the end of the cycle.
That leaves the central question for 2026 onward dangling unresolved, particularly as renewed financing pressure meets further mortgage resets in UK, and ramped up financing costs elsewhere. Are we seeing an extended final phase before a larger downturn, with price dynamics disrupted, but the underlying wave structure still intact? Or has a significant part of the correction already taken place through time and inflation, with Covid acting as a kind of ‘war-like’ shock that resets the normal wave structure? In the latter version of reality, the pandemic-era peaks of 2021–22 would mark a dramatically shortened final upswing, and indeed leave markets well into the subsequent adjustment in some locations. In the former case though, the market cycle is viewed as distorted, some countries more than others, but ultimately runs into the usual late cycle pressures, especially from inflation driven rate hikes, and normal peak window.
Prices and the related economics need not turn together of course. Inflation and rising incomes can absorb some of the earlier valuation excesses while higher borrowing costs nonetheless continue to have macro spillover via dragging spending and sector activity.
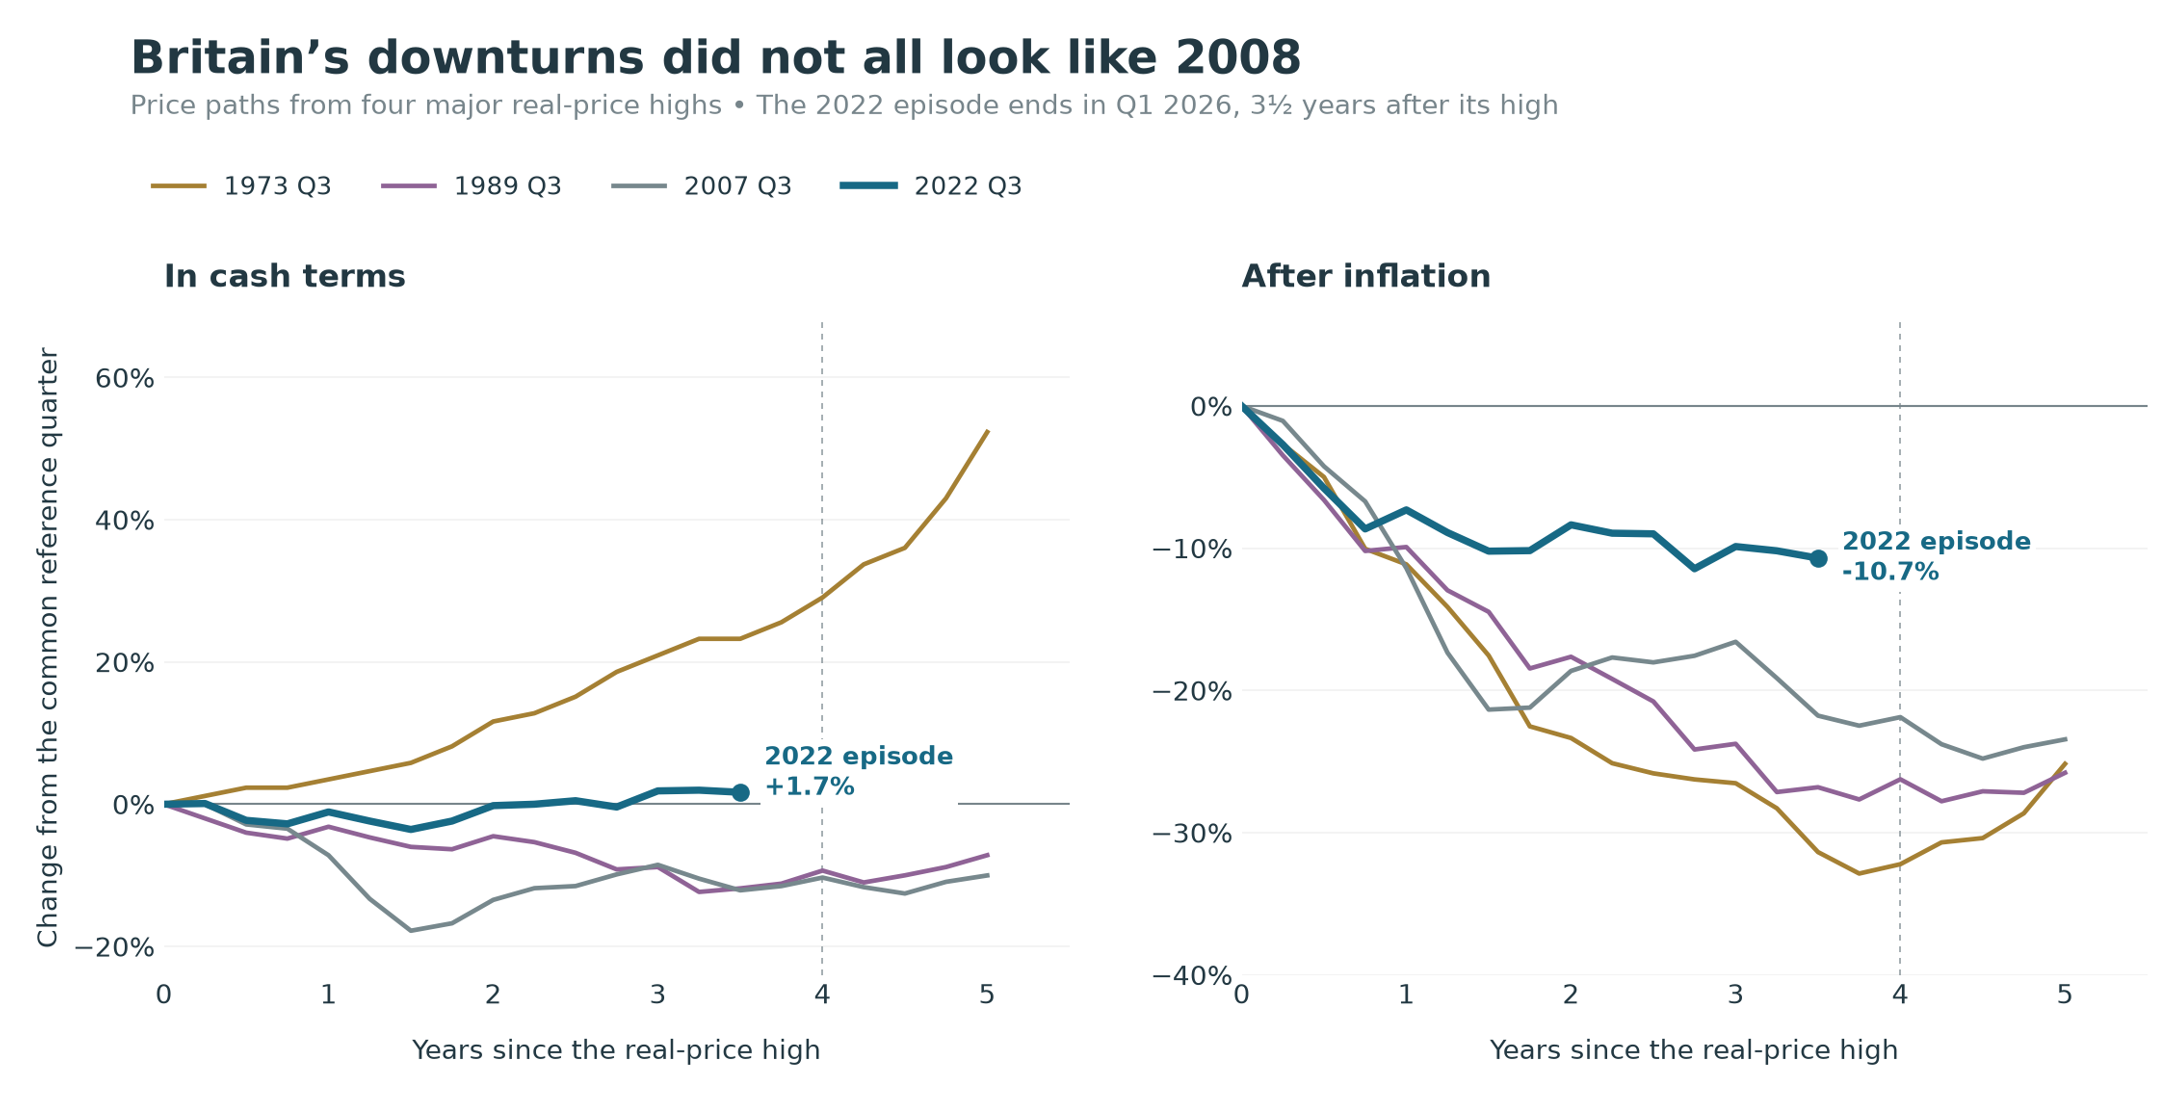
Chart 3: UK past drops from peaks have varied from nominal to real
Source: BIS data; CE
Inflation doing the bulk of the corrective work is hardly unprecedented. During 1973-1977, UK house prices inflated sharply in cash terms but fell 29% in real terms. Land itself was actually more classically aligned, falling roughly a third in nominal terms by 1975 (nodding back to the original Harrison roots).
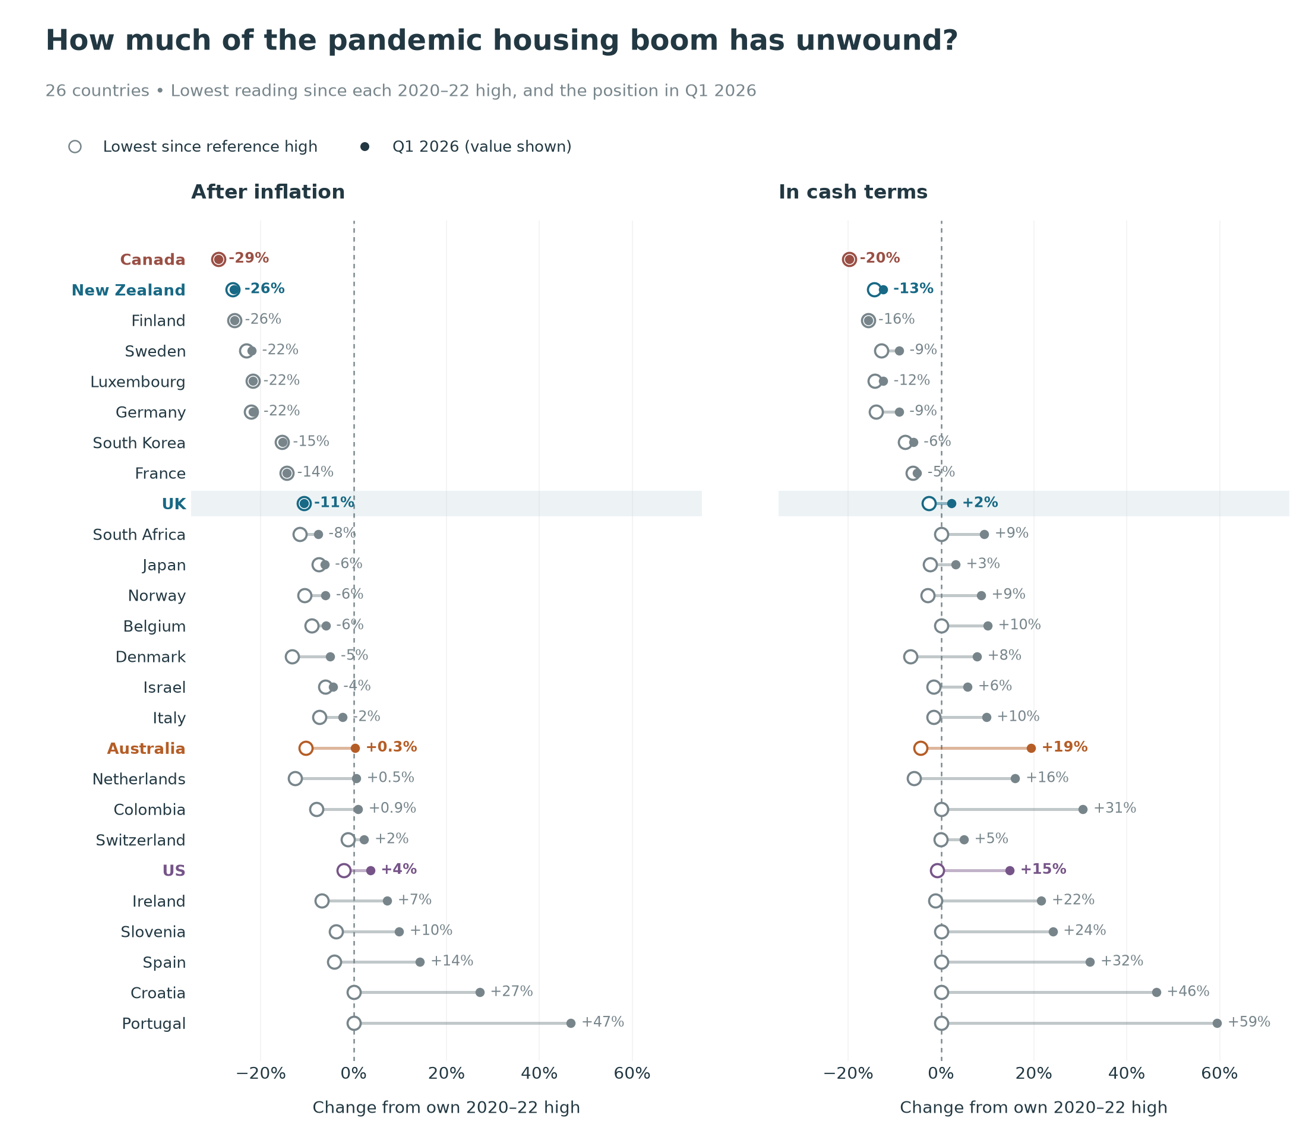
Chart 4: Global deviations in recent performance
Source: Dallas Fed data; CE
There has already been a fair amount of that corrective work this time, on the housing side at least. UK prices were around 3% above their September 2022 level in cash terms, but 11% lower after inflation. Canada and New Zealand more markedly have suffered real falls in the order of 30% by early 2026, Germany around 20%. And the retreat has become less widespread after being near uniform out of the global covid mini boom-bust impact: 23 of 26 markets in the Dallas Fed panel were falling in real terms year on year in mid-2023, now down to less than half in early 2026, with many European countries still faring comparatively well. That hardly settles the wave count either way, but it makes for a much less straightforward and uncomplicated story than 2007.
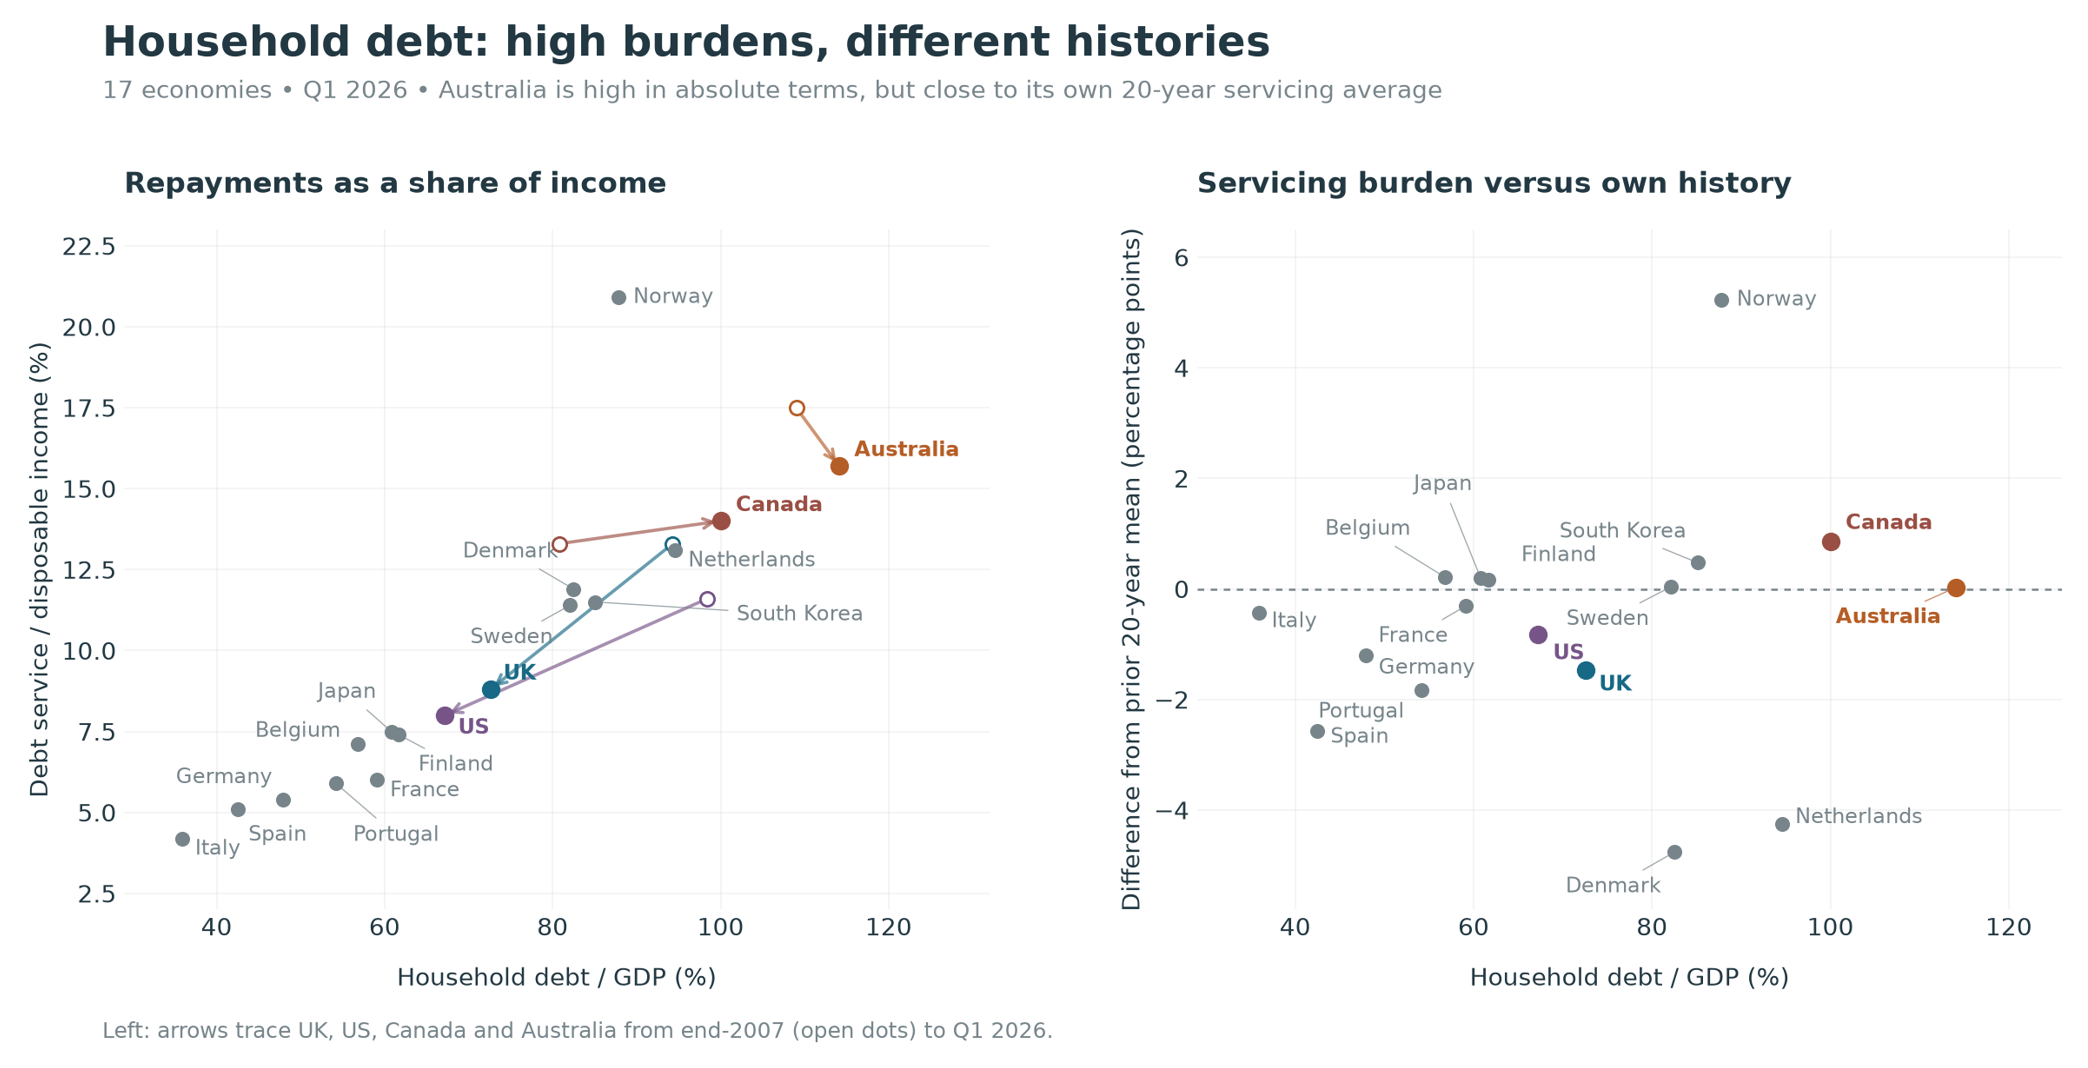
Chart 5: Different shifts in household debt and servicing ratios
Source: BIS data; CE
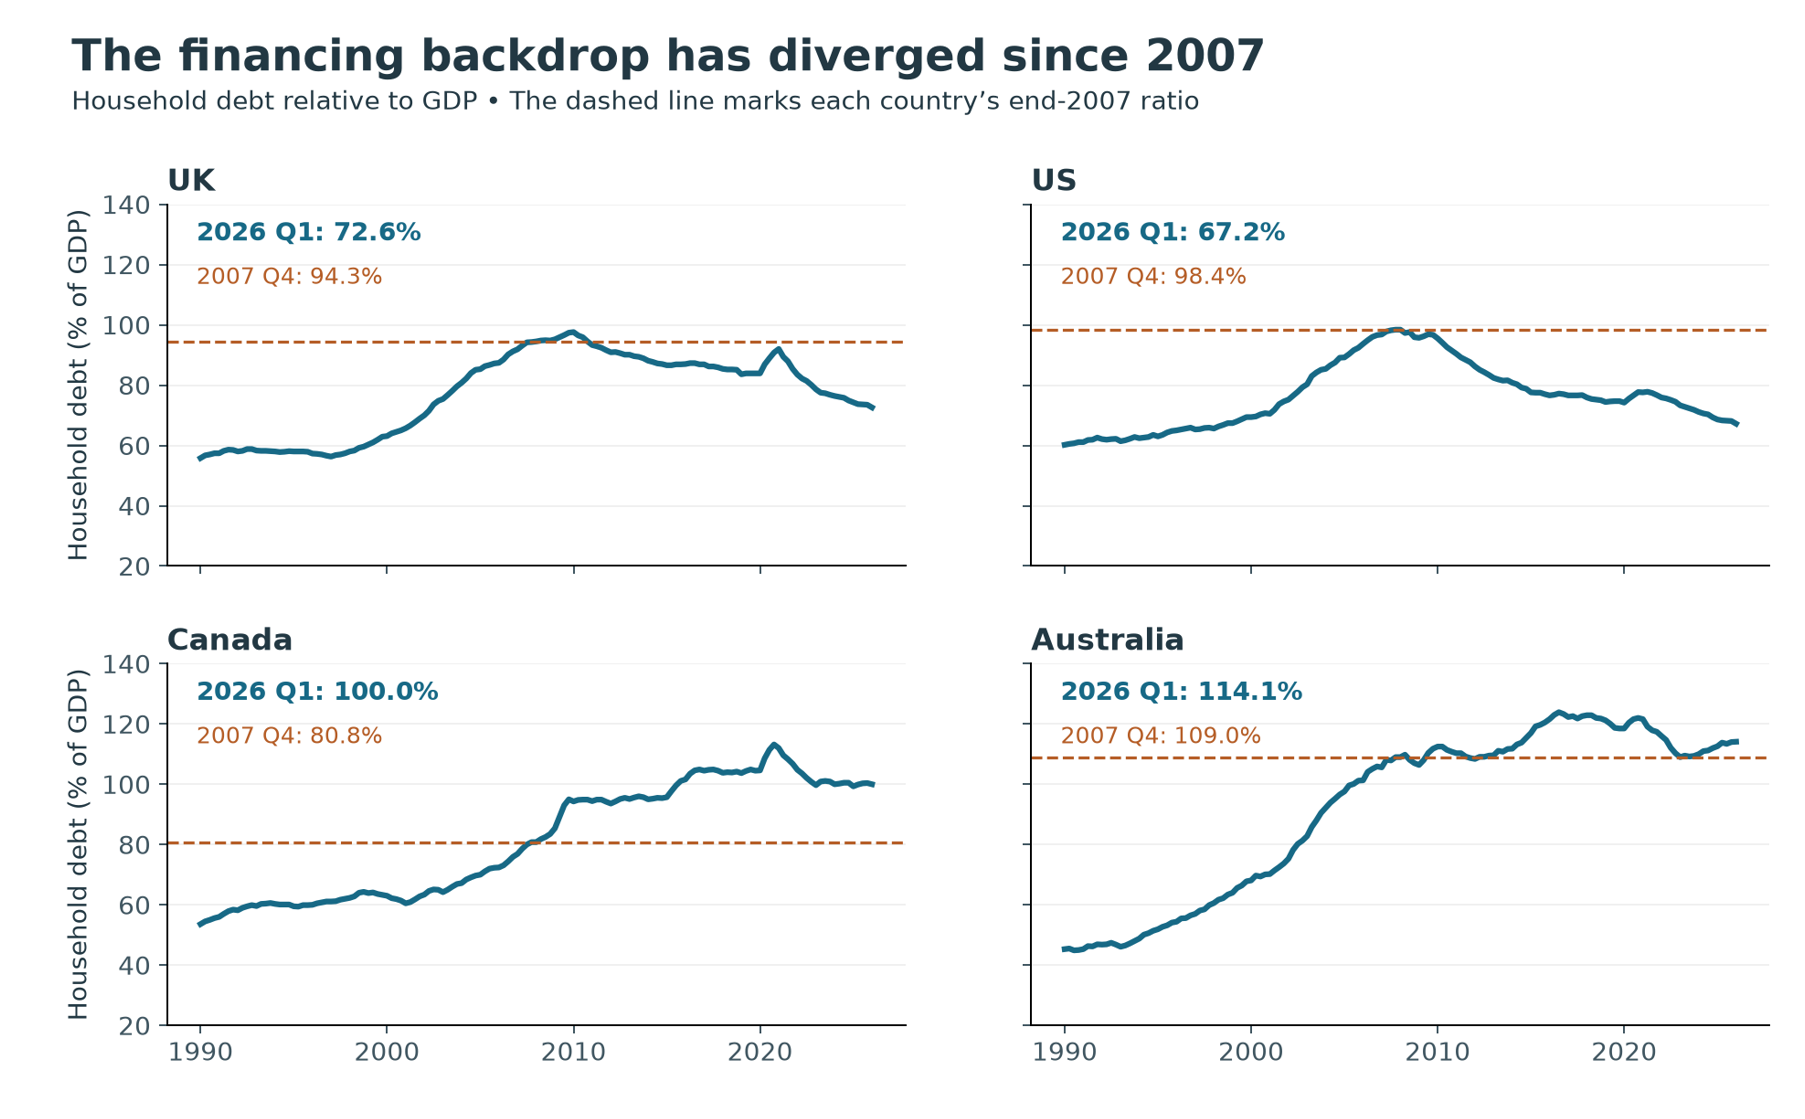
Nor is the fundamental starting point uniform or typically indicative, with increasing global variation evident. Household debt relative to GDP is substantially lower in UK and US than in 2007, down some 20 to 30pp respectively, and reducing the starting base for any upward pressure on servicing costs. Canada in contrast is up sharply and Australia is back to the highs, albeit with service costs only in the last few months moving above its long-term average. That backdrop creates quite a lot of variation into the current interest rate acceleration as well as reflecting some country-level structural factors.
Figure 6: Household debt ratio changes since GFC
Source: BIS data; CE
The UK also has stronger lending standards than before the financial crisis. Some of those restrictions are now easing, however, and the government is focused again on facilitating first-time buyers into the market. Labour’s newly-announced ‘Your First Home’ scheme proposes 20% equity loans for eligible buyers, with deposits as low as 2.5%. Details are due at the October Budget, but housebuilder shares have already rallied. Macro backdrop and details dependent, that could inject some fresh demand into the base of the housing demand chain.
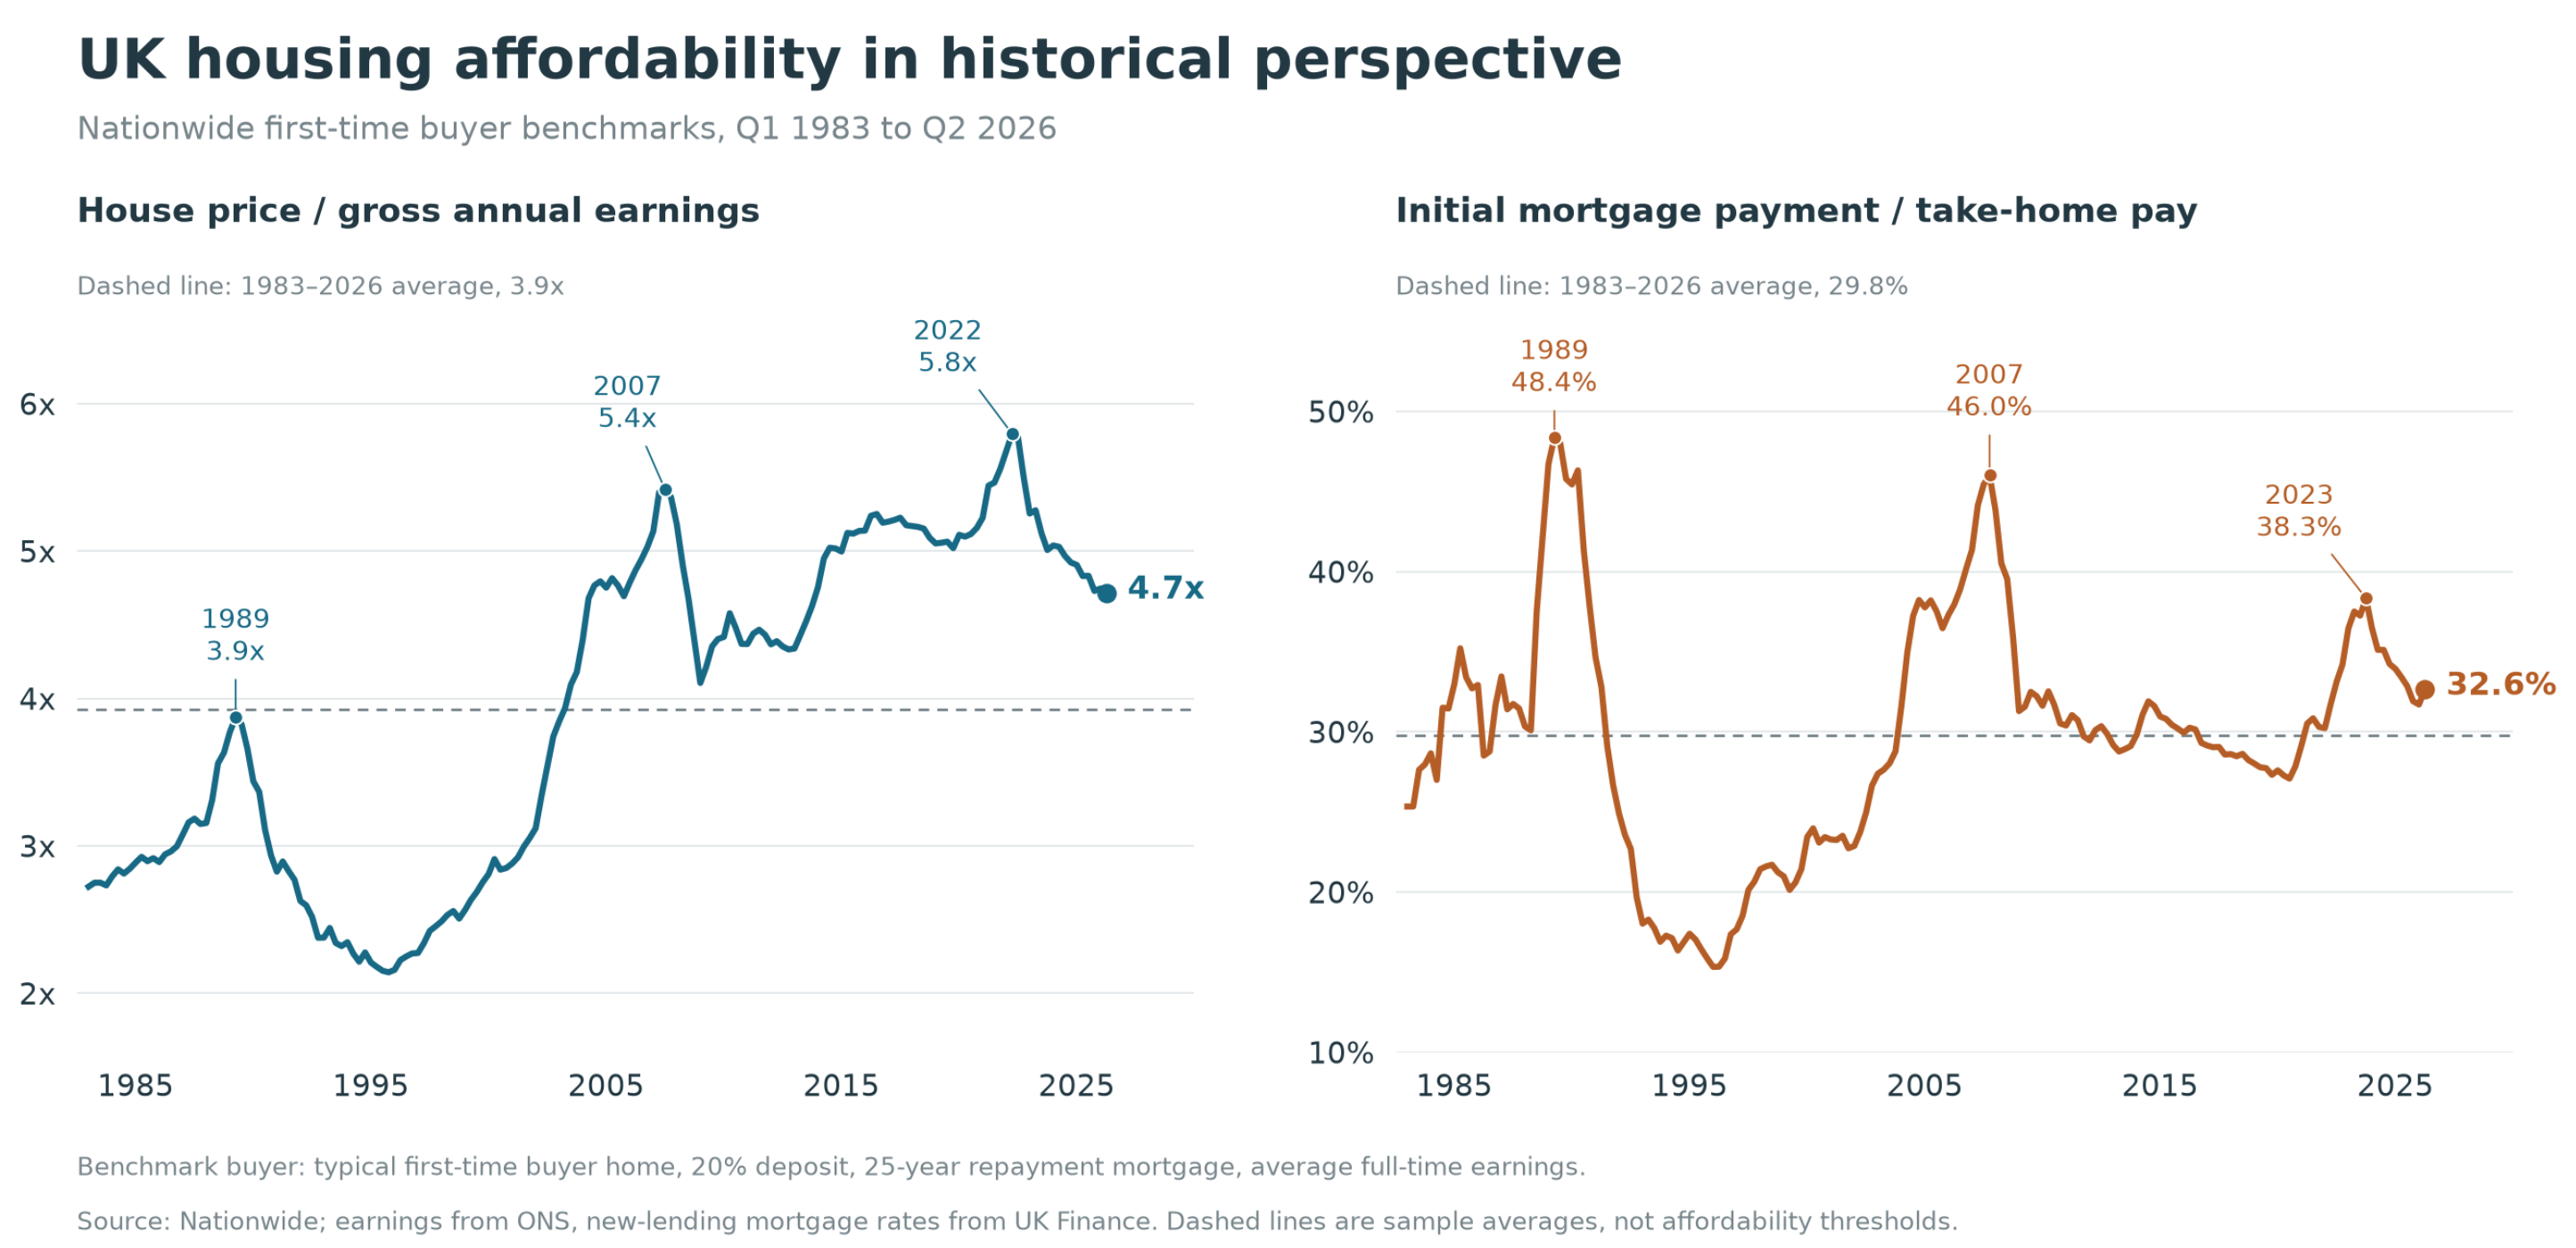
Figure 7: Affordability ratios improved (if flattered by use of averages and ignoring essentials cost of living)
Source: Nationwide
In the US, current 7%+ refinancing rates create formidable obstacles to moving for buyers that have existing cheap pandemic-era mortgages. Fed research found that this mortgage lock-in depressed mobility and, in stalled markets, supported prices in the initial post pandemic years. This factor is likely intensified anew now as interest rates have stepped sharply higher.
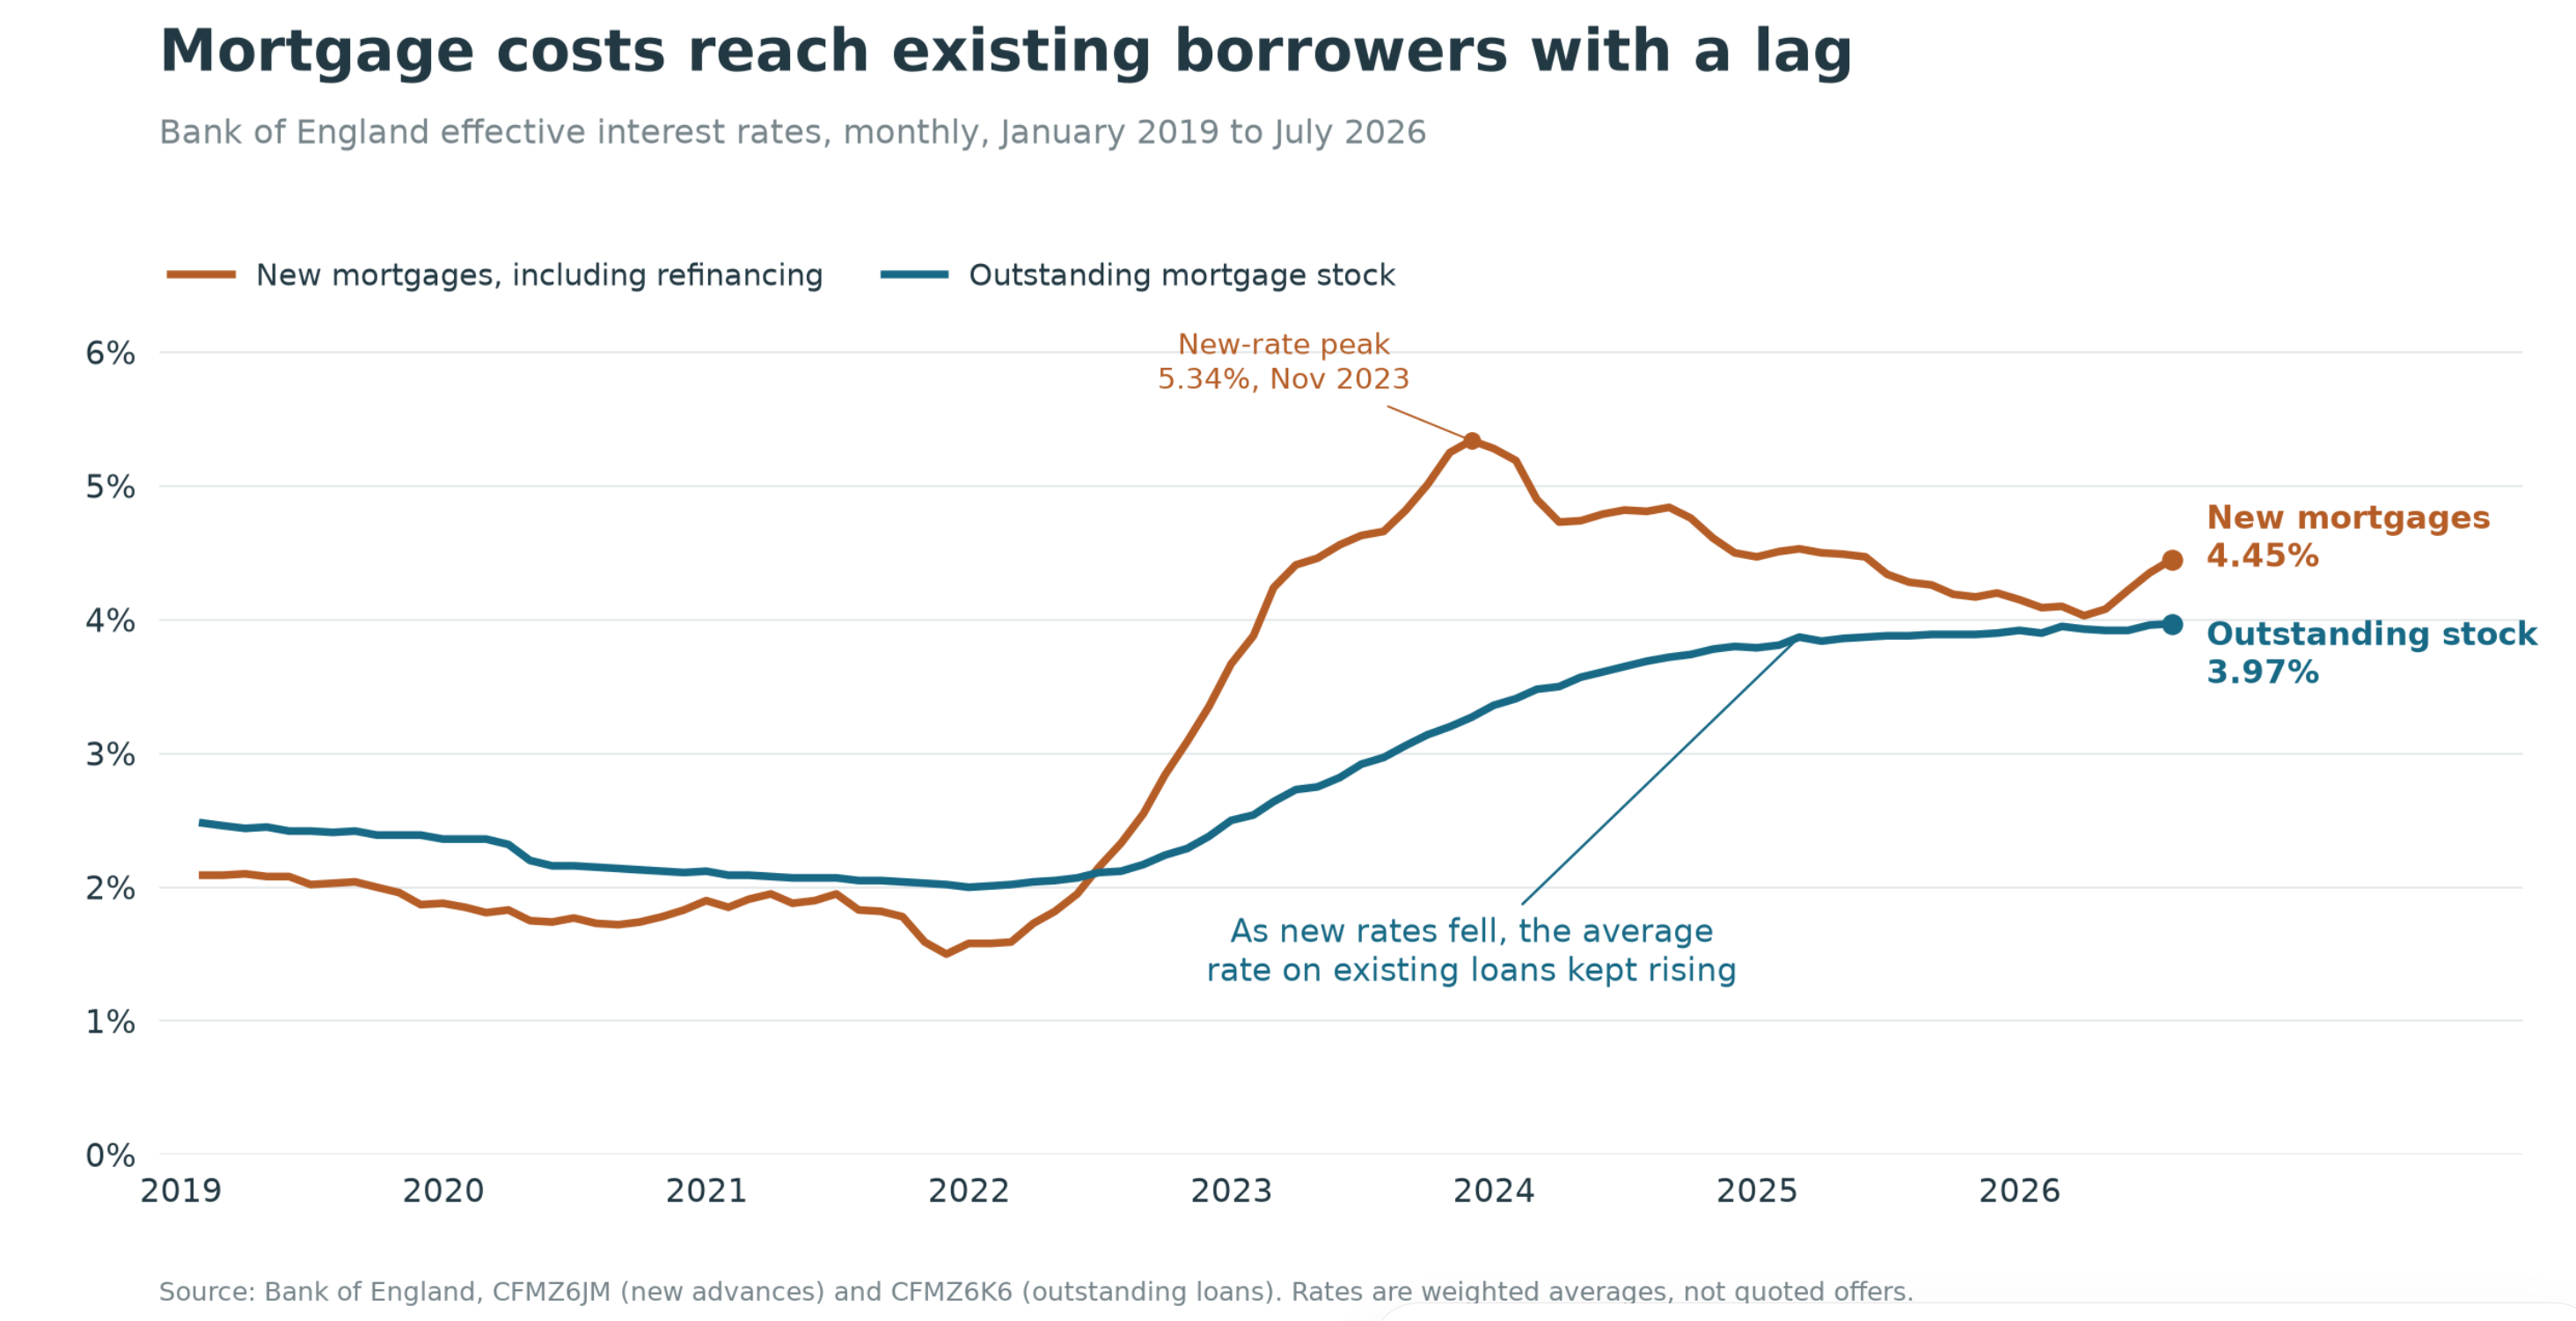
UK has a more direct mortgage-reset problem, one of the factors making the BoE reluctant to tighten excessively, although BoE research suggests that this current wave should be smaller than the first, with the main impact being felt in a smaller subset of the outstanding stock that had the latest, longest fixes out of covid. Australia’s borrowers have had healthy offset and redraw balances to cushion higher repayments, with evidence that this has supported to date, so long as the labour market holds up. With RBA rates still pushing north that can still spillover onto a squeeze on other discretionary spending however and the RBA is cognisant of this and growth risks while still having to focus on inflation and hoping a recession is not the result.
Figure 8: Tightening from mortgage rises coming through with lag
Source: BoE
Which brings the focus back to the wider cross-currents, from the current supply shock to the evolving AI impact. Wealth effects, investment in the AI build-out and potential productivity gains sit on one side, to various extents; upward pressure on inflation, interest rates and cost of living sits on the other. AI labour enhancement versus labour substitution at scale remains the more critical long-term question for consumers and housing further out.
So the 18-year danger window arrives with familiar later cycle concerns over an inflation-fighting rate cycle, but divergent debt burdens, servicing costs and bank balance sheets. Alongside them sit the structural upheaval of AI and the unusual Covid 'cycle within the cycle'.
With the current financial cycle dominated by equity and private credit rather than housing leverage, this may prove a housing cycle that follows the wider macro and financial lead from elsewhere rather than initiates it.
The results may differ by country. The UK could be absorbing (at least part of) an earlier peak through the erosion of time and inflation, though a soft labour market could prove a concern. The US could be navigating a more recognisable final upswing, but with higher rates a blunt trigger while broader (if frothy) macro momentum remains. If incomes catch up, transactions and building recover, and crucially the geopolitical supply shock abates, the more benign interpretation (a weirdly off kilter cycle with a fortituous real soft landing) gains ground. If activity weakens and employment follows, the recent resilience may yet prove a final “time rally” before a larger downturn - or, in markets that have already corrected substantially, a resumption of the initially inflation led adjustment.