Chart USD/MXN Update: Fresh year highs

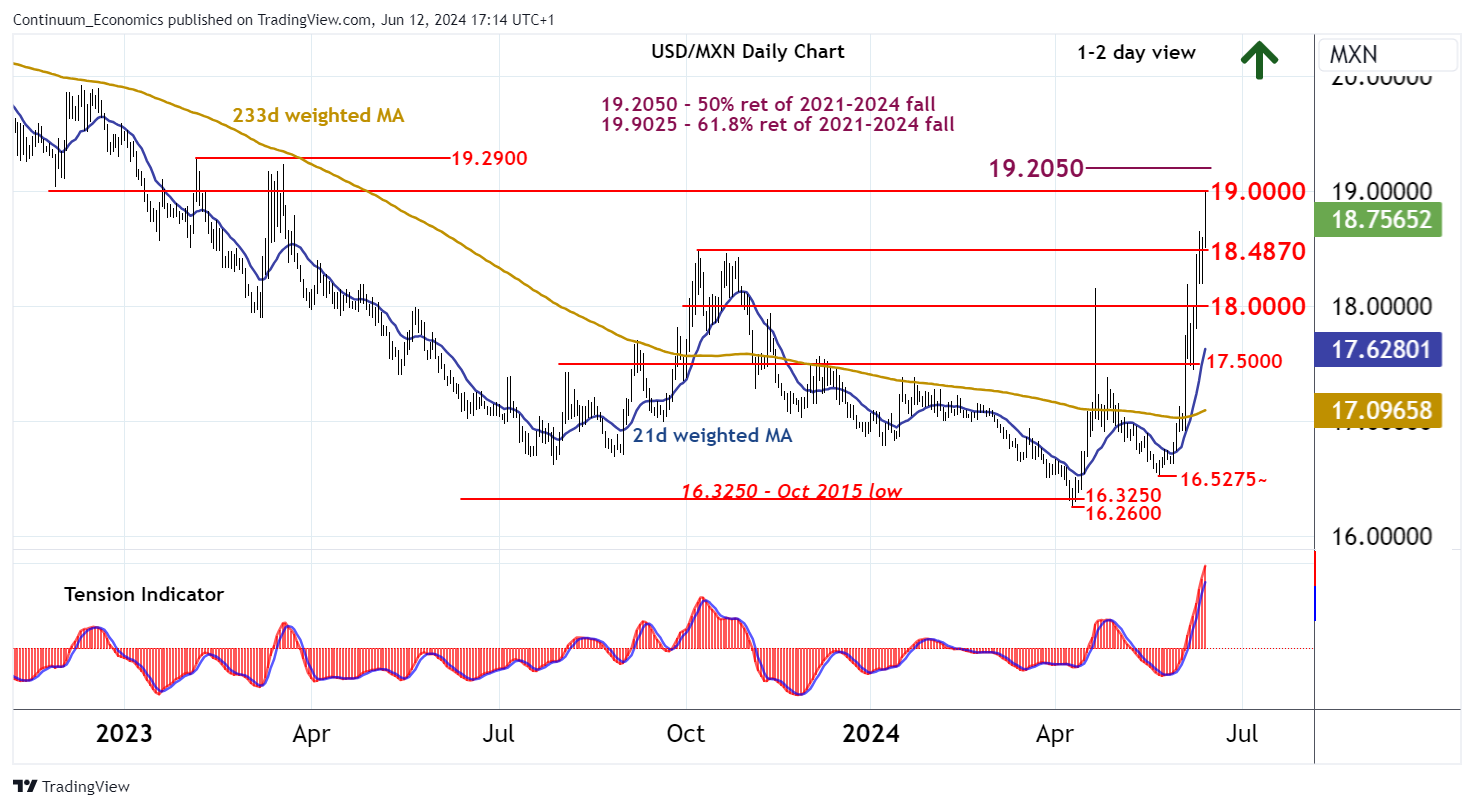
Anticipated gains have reached 19.0000, where flattening overbought daily stochastics are prompting fresh reactions
| Levels | Imp | Comment | Levels | Imp | Comment | |||
|---|---|---|---|---|---|---|---|---|
| R4 | 19.4000 | ** | congestion | S1 | 18.4870 | ** | 6 Oct (m) high | |
| R3 | 19.2900 | ** | 6 Feb 2023 (m) high | S2 | 18.0000 | * | congestion | |
| R2 | 19.2050 | ** | 50% ret of 2021-2024 fall | S3 | 17.5000 | * | break level | |
| R1 | 19.0000 | ** | congestion | S4 | 17.3850 | * | 17 Jan (m) high |
Asterisk denotes strength of level
17:00 BST - Anticipated gains have reached 19.0000, where flattening overbought daily stochastics are prompting fresh reactions. The daily Tension Indicator continues to strengthen and background weekly charts are positive, highlighting room for further strength in the coming sessions. A close above 19.0000 will extend April gains towards the 19.2050 Fibonacci retracement, but overbought daily stochastics could limit any immediate tests in consolidation, before prices break higher. Meanwhile, support is at the 18.4870 monthly high of 6 October. An unexpected close beneath here will add weight to sentiment and open up a pullback towards congestion around 18.0000.