Published: 2024-06-05T16:06:06.000Z
Chart USD/MXN Update: Higher levels sharply rejected

Senior Technical Strategist
-
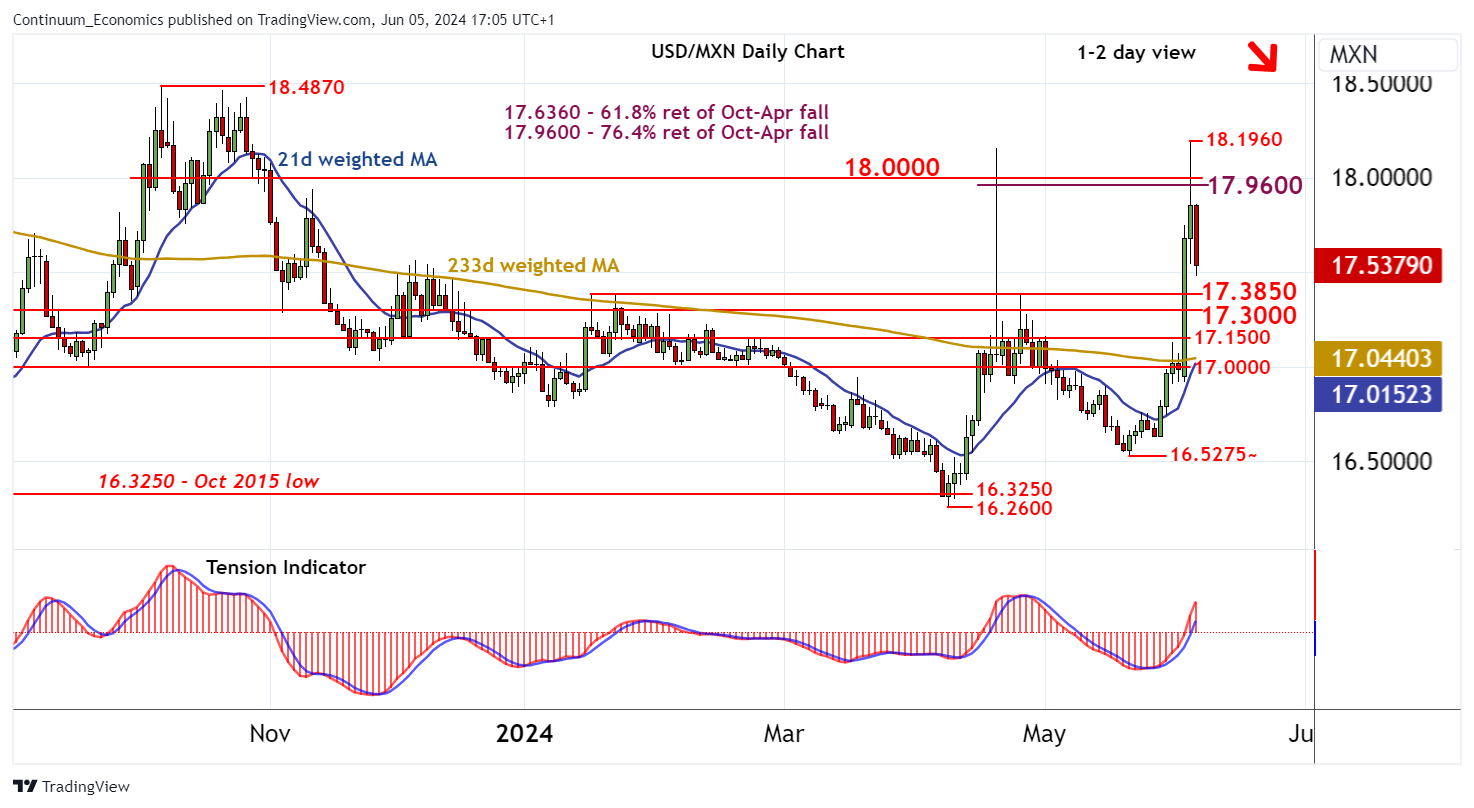
Anticipated gains have tested above strong resistance within the 17.9600 retracement and congestion around 18.0000
| Levels | Imp | Comment | Levels | Imp | Comment | |||
|---|---|---|---|---|---|---|---|---|
| R4 | 18.1960 | ** | 4 Jun high | S1 | 17.3850 | * | 17 Jan (m) high | |
| R3 | 18.0000 | ** | congestion | S2 | 17.3000 | * | congestion | |
| R2 | 17.9600 | ** | 76.4% ret of Oct-Apr fall | S3 | 17.1500 | * | congestion | |
| R1 | 17.8575 | intraday high | S4 | 17.0000 | * | congestion |
Asterisk denotes strength of level
16:50 BST - Anticipated gains have tested above strong resistance within the 17.9600 retracement and congestion around 18.0000, reaching 18.1960 before reversing sharply lower. Overbought daily stochastics are unwinding, highlighting potential for a test of support at the 17.3850 monthly high of 17 January. However, the rising daily Tension Indicator and improving weekly charts are expected to limit any deeper losses in consolidation above congestion around 17.3000. Meanwhile, a close above 17.9600 is needed to turn price action positive and confirm continuation of April gains.