Published: 2024-05-24T07:37:06.000Z
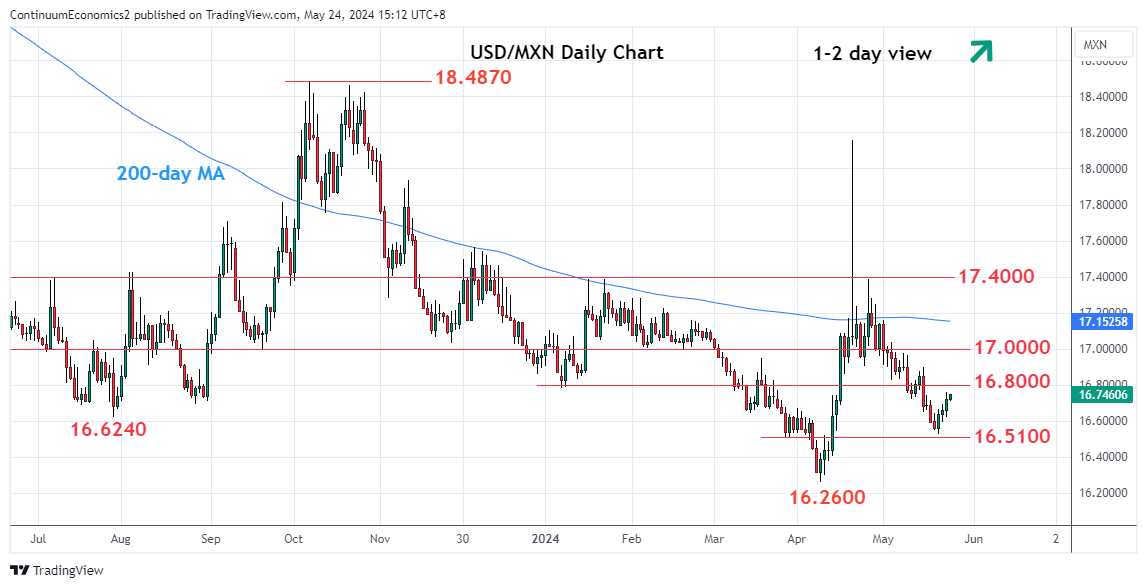
Chart USD/MXN Update: Extending corrective bounce from 16.5100 support

Senior Technical Strategist
-
Turned up in consolidation from support at the 16.5100, March low
| Levels | Imp | Comment | Levels | Imp | Comment | |||
|---|---|---|---|---|---|---|---|---|
| R4 | 17.1600 | 1 May high | S1 | 16.6500 | * | 15 May low, congestion | ||
| R3 | 17.0000 | * | congestion | S2 | 16.5100 | * | Mar low | |
| R2 | 16.9050 | * | 24 Apr low | S3 | 16.4000 | * | congestion | |
| R1 | 16.8000 | * | Jan low, congestion | S4 | 16.3000 | figure |
Asterisk denotes strength of level
07:30 GMT - Turned up in consolidation from the 16.5100, March low, as prices unwind the deep oversold daily studies. Break above 16.6500 resistance clears the way for stronger bounce to resistance at the 16.8000 congestion. Higher still, will see room to the strong resistance at the 16.9050/17.0000 area which is expected to cap. Corrective bounce expected to give way to fresh selling pressure later with support now raised to the 16.6500/16.6000. Break here will expose the 16.5100 support to retest and where break will return focus to the April YTD low at 16.2600.