Published: 2024-05-24T02:57:27.000Z
Chart USD/MYR Update: Extending corrective gains

Technical Analyst
-
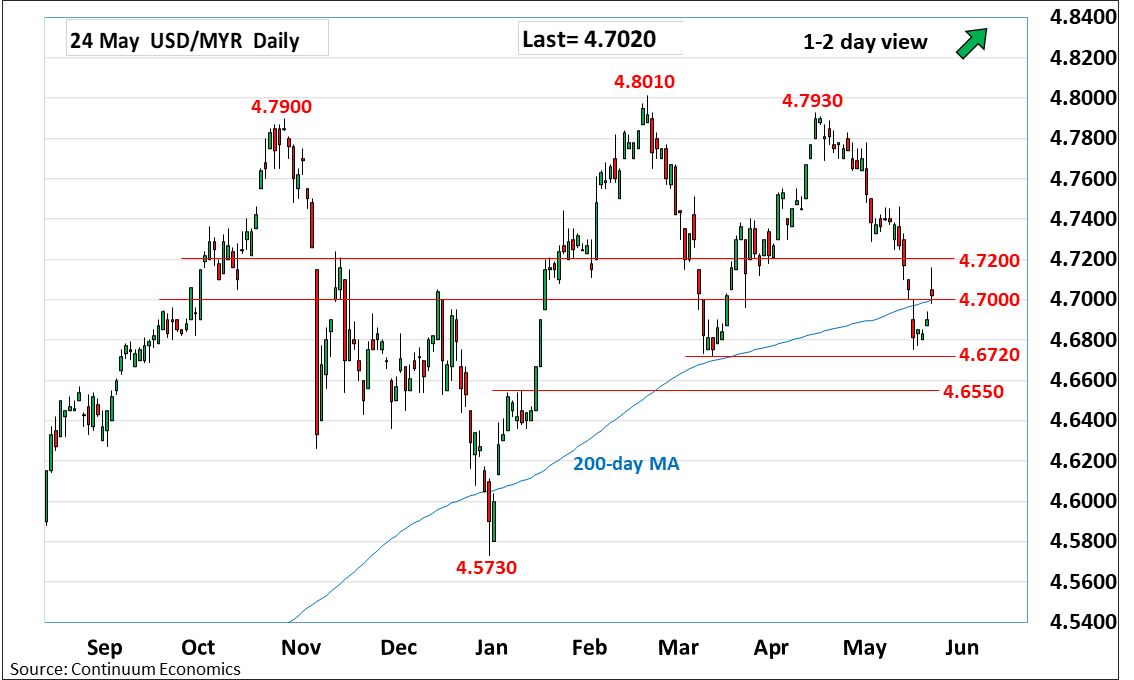
Break above the 4.7000 level extending gains from the 4.6750 low
| Levels | Imp | Comment | Levels | Imp | Comment | |||
|---|---|---|---|---|---|---|---|---|
| R4 | 4.7460/80 | * | 13 May high, 61.8% | S1 | 4.7000 | * | congestion | |
| R3 | 4.7340 | * | 50% Apr/May fall | S2 | 4.6750/20 | ** | 16 May, Mar lows | |
| R2 | 4.7290 | * | 3 May low | S3 | 4.6660 | * | 61.8% Dec/Feb rally | |
| R1 | 4.7200 | * | congestion, 38.2% | S4 | 4.6550 | * | 10 Jan high |
02:50 GMT - Break above the 4.7000 level extending gains from the 4.6750 low as prices retrace losses from the 4.7930, April YTD high. Gains are seen corrective and nearby see resistance at the 4.7200 congestion and 38.2% Fibonacci level. Clearance, if seen, will scope to the 4.7290/4.7340 resistance though corrective expected to give way to fresh selling pressure later. Break of the 4.6750/4.6720 lows will confirm a double top at the February/April highs and see room for deeper retracement of the broad December/February rally. Lower will see scope to 4.6660, 61.8% Fibonacci level.