EM Government Debt Sinners and Saints
· Overall, the clearest EM fiscal sinner is Brazil, given its tax revenue/GDP ratio is already very high and requires politically sensitive expenditure cuts after the October election to increase the primary surplus to stabilize the government debt/GDP trajectory and get real bond yields down. S Africa also needs to maintain fiscal consolidation to avoid backsliding and end up in the fiscal sinner camp again, with high real yields. In terms of EM fiscal saints, no clear winner exists among the big countries. Mexico government debt/GDP is moderate compared to EM and DM debt sinners, but long-term political interference issues are curtailing the scale of furthering yield spread narrowing versus the U.S.
We have focused on DM government debt fiscal sinners and saints (here), but what about EM?
Figure 1: General Government Debt/GDP (%)
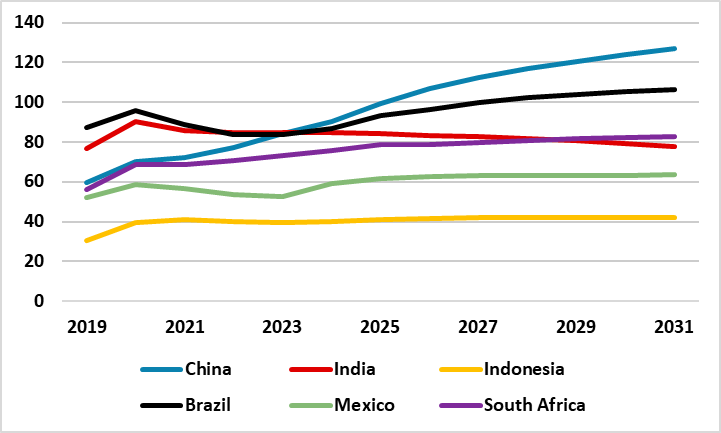
Source: IMF Fiscal Monitor April 26/Continuum Economics
Looking at big EM countries a number of metrics are worth highlighting. Firstly, IMF measures of gross government debt/GDP (Figure 1). Brazil remains a cause for concern with the outcome of the October presidential election a key focus. S Africa has started to stabilise, while high nominal GDP growth in India helps to bring the ratio down later in the decade. The big deterioration is China, where the IMF measure is well above the central government measure favoured in Beijing as the IMF adds 2/3 of LGFV debt.
The 2nd measure to look at is the primary budget balance excluding debt servicing costs (Figure 2), where S Africa’s swing to a primary surplus has been rewarded in 2025 by ratings agency upgrades and bond spread narrowing versus the U.S. (Figure 4). Mexico maintains a primary surplus and Brazil is trying but political progress is slow. One route for EM is to raise the tax revenue/GDP ratio by broadening the tax base with the move to middle income status and beyond. The problem for Brazil is that revenue/GDP at 40% of GDP is already maxed out (the G20 EM average is 26%). China and Indonesia have multi-year scope to broaden tax basis and get up to the G20 EM average for revenue/GDP. China primary deficit is also persistently large, but debt servicing costs are low due to financial repression in China. Even so, China authorities are reluctant to broaden or reform the tax base (e.g. higher income tax or annual property tax), partially on concerns it would upset households support for the communist party.
Figure 2: Primary Balance to GDP (%)
Source: IMF Fiscal Monitor April 26/Continuum Economics
Figure 3 shows other key debt metrics, where Brazil average term to debt maturity is low and leaves it requiring high real debt servicing costs from domestic investors and keeping the overall deficit high. Brazil, S Africa and Mexico also have positive interest rate to growth differential, which means that they are stuck with high real yields than the other big EM’s and wider spread versus the U.S. (Figure 4). This makes it difficult to get the overall budget deficit declining. S Africa political frictions over high unemployment probably suggest the multi-year spread narrowing versus the U.S. will slow, but Mexico relatively stable government and moderate government/debt GDP trajectory could see multi-year spread narrow once a revised USMCA deal is agreed (here). On non-resident holdings of pct of total government debt, Indonesia dependency on foreign funds remains an issue. This is not just in government debt yields formation, but also as IDR outflows can prompt Bank Indonesia to tighten and lift the whole bond yield curve! China and India remain dominated by local institutions, which allows moral suasion from authorities to sustain low real yields and controlled bond yield spreads versus the U.S.
Figure 3: Key Debt Metrics (%)
| Ave Term to Debt Maturity | Interest Rate-Growth Differential 2026-31 | Non Resident Holdings (% of Total) | |
| Brazil | 5.4 | 2.8 | 10.5 |
| China | 6.4 | -3.7 | 2.2 |
| India | 9.3 | -3.2 | 5.2 |
| Indonesia | 8.7 | -1.8 | 35.9 |
| Mexico | 8.2 | 3.7 | 20.3 |
| S Africa | 10.6 | 2.2 | 26 |
Source: IMF Fiscal Monitor April 26/Continuum Economics
Figure 4: 10yr Government Bond Spread versus U.S. (%)
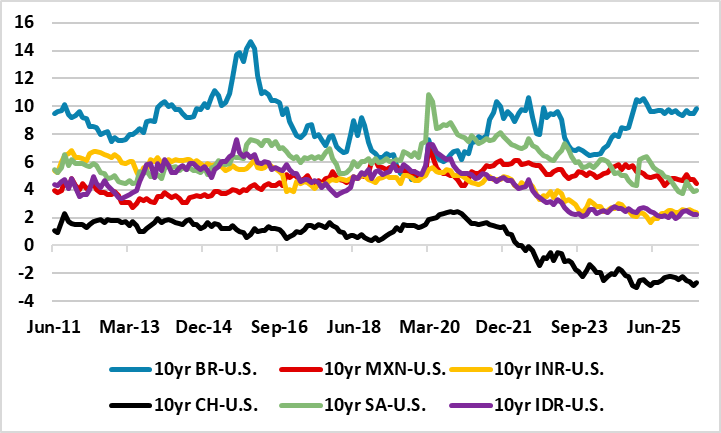
Source: Datastream/Continuum Economics
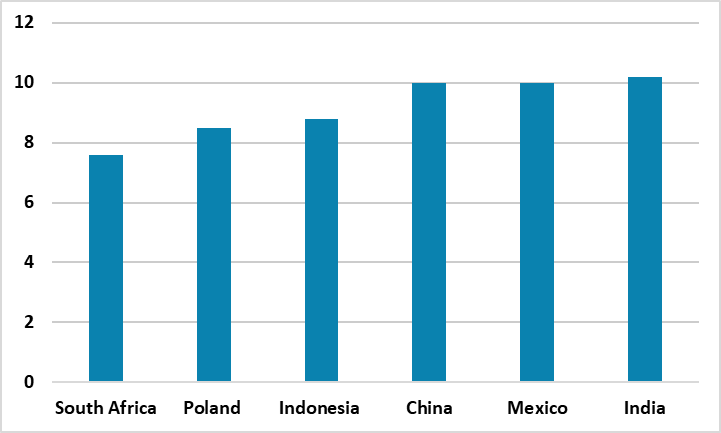
The final issue is weighting in international EM government bond indices (Figure 5), with Saudi Arabia weighting being increased on a stepped basis. However, for some countries the percentage of foreign investors is low meaning they do not help to determine yields, but in Indonesia and a less degree S Africa foreign investors are important.
Figure 5: J.P. Morgan EM Local Government Bond Country Weights

Source: JP Morgan
Overall, the clearest EM fiscal sinner is Brazil, given its tax revenue/GDP ratio is already very high and requires politically sensitive expenditure cuts after the October election to increase the primary surplus to stabilize the government debt/GDP trajectory and get real bond yields down. S Africa also needs to maintain fiscal consolidation to avoid backsliding and end up in the fiscal sinner camp again, with high real yields. The final sinner is China with no fiscal consolidation to reduce the large primary budget deficit. Financial suppression by the authorities means that this is an economic issue rather than market and yields could easily remain suppressed for the next 5 years – but the 2030’s could be tricker.
In terms of EM fiscal saints, no clear winner exists among the big countries. Russia government debt/GDP is low, but uninvestable until a credible and lasting peace deal is seen in the Ukraine. Mexico government debt/GDP is moderate compared to EM and DM debt sinners, but long-term political interference issues are curtailing furthering yield spread narrowing versus the U.S. India has the windfall of high nominal GDP, but the general government debt/GDP is still moderately high rather than low.
Over the summer, we will followthrough with more detailed analysis on some of these big EM countries.