Strong UK Growth in Q3, As Expected, Headwinds Still Ahead
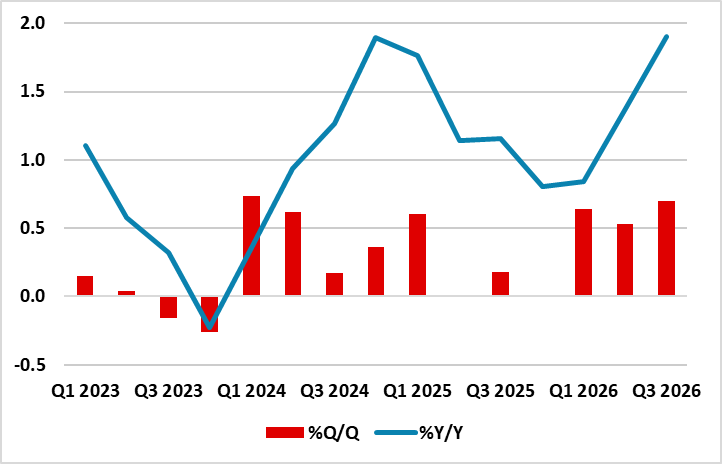
The UK economy grew strongly in Q3, as expected, rising 0.7% q/q and boosted by solid activity in the service sector. In quarterly terms this is the strongest increase in two years and AI’s contribution to the economy continues to felt. As in recent quarters, output in that sector was driven by administrative and support service activities, information and communication, and professional, scientific and technical activities. As we argued in our GDP preview, the UK economy has shown tremendous resilience in the face of rising inflation and energy shocks, increased uncertainty, fiscal pressures and higher interest rates. But headwinds will weigh on consumer spending as we head into the final quarter of this year and early in 2027.
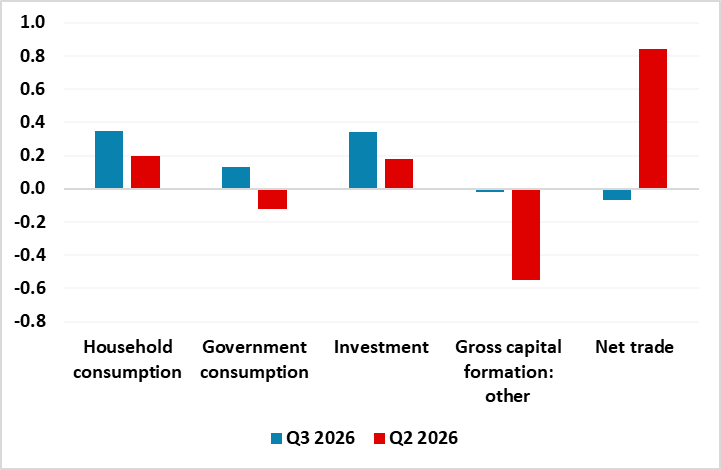
While the figures for Q3 were undoubtedly strong Q3, they serve to provide a rear-view glimpse of the UK economy with the picture looking less encouraging if we look ahead. That becomes evident when we break down GDP growth by expenditure components and see that growth in Q3 was boosted by household consumption and investment.
Heading into Q4, households’ consumption is likely to slow as higher inflation reduces households’ real incomes. The price cap for January–March 2027 will increase significantly, by roughly 16% to 28% for customers on the standard variable tariffs (SVT), bringing typical annual bills to roughly £1,999–£2,182. Ofgem had already lifted the energy price cap by 4% (an increase of £60 per year) from October to 31 December 2026. That will come on top of higher borrowing costs, making the cost of debt servicing even more expensive at a time when credit card defaults continue to increase as the Ban of England tightens monetary policy again in the new year.
Rising global energy prices, elevated borrowing costs, and recent fiscal policy adjustments are expected to weigh on household consumption and business activity heading into year-end. Growth is now expected to slow to around 0.2-0.3% q/q in the final quarter of this year.
Figure 1: Q3 GDP Growth Strongest in 2 Years (%Q/Q and %Y/Y)
Source: Datastream/CE
Figure 2: GDP Breakdown by Expenditure Component (%Q/Q)
Source: Datastream/CE