EM Money Supply: Trends Diverge from Policy Rates
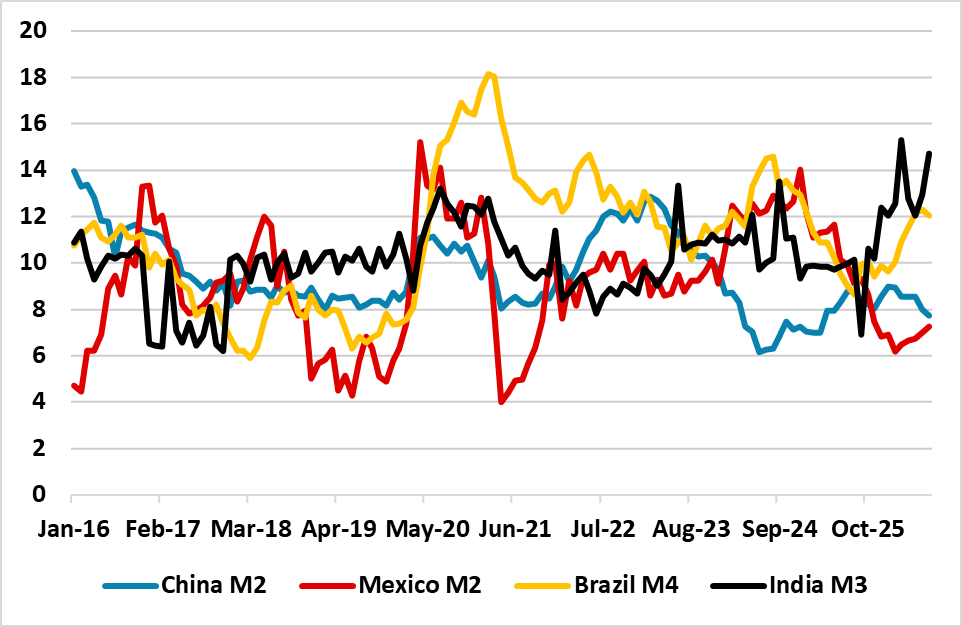
· M2 growth in China remains weak (pre 2015 the trend had been double digit), despite the low level of nominal and real policy rates. This reflects credit demand and supply problems. M2 growth will likely remain restrained by Chinese standards and act as a drag of nominal and real GDP growth.
· India M3 growth has accelerated during 2026 (Figure 1), which partially reflects policy easing since 2025 by the RBI and as the banking system is much healthier than the mid-2010’s after a clean-up of NPL’s. India should continue to see good money supply growth that supports nominal and real GDP growth.
· Brazil M4 growth has picked up rather than slowed down, despite the ultra-restrictive stance of the BCB and high nominal and real policy rates. These tailwinds for Brazil M4 growth are unlikely to slow into 2027 and this is one reason that the BCB could be cautious in the pace of easing.
With Fed Chair focusing on money growth, what is happening in big EM countries?
Figure 1: Big EM Money Supply Growth (Yr/Yr %)
Source: Datastream/Continuum Economics
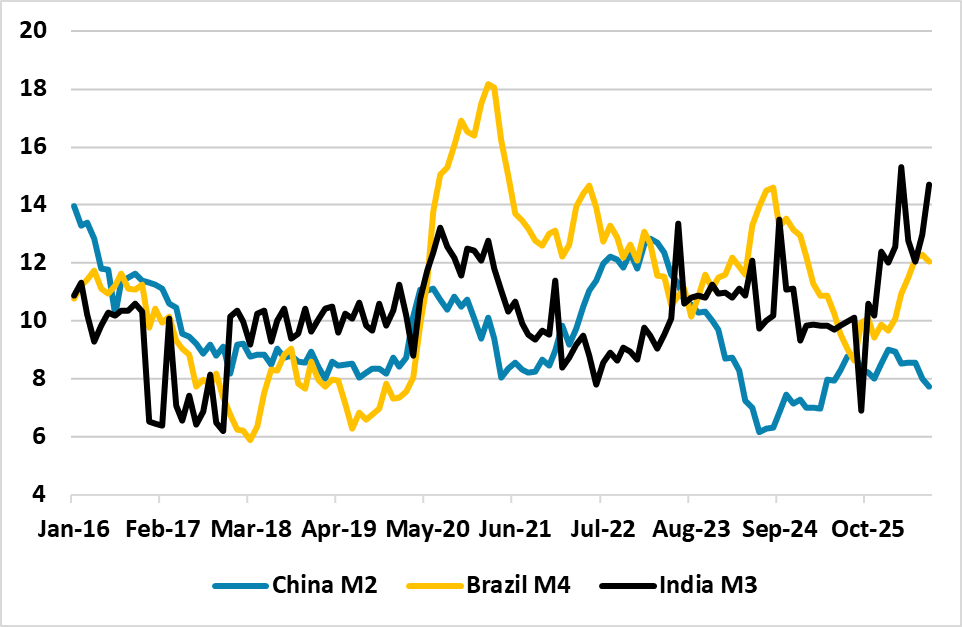
Money supply growth trends vary across big EM countries and are out of tune with policy rate levels. Figure 1 shows that M2 growth in China remains weak (pre 2015 the trend had been double digit), despite the low level of nominal and real policy rates. This reflects credit demand and supply problems. Household lending is close to zero, which reflects the hangover from the residential property burst since 2022, as China households are keen to pay down some existing borrowing and new borrowing has been sluggish. The weakness of private sector wage growth and employment has also contributed to the weak confidence among households and the private sector. Additionally, credit supply is restricted in the small rural and city commercial banks, which are suffering from weak lending before the residential property bust and are restraining lending. One way of looking at this is the BIS credit gap between actual and trend in Figure 2. Borrowing excess peaked in China in 2016 and has now shifted to below trend. China’s authorities injected equity capital into the six largest banks in 2025 to boost lending and in early September announced an additional RMB360bln for two extra state owned banks and two major life insurance companies. The problems for the small banks is moderate, but could become acute according to the 2023 PBOC stress tests if non-performing loans (NPL’s) were to double (here). M2 growth will likely remain restrained by Chinese standards and act as a drag of nominal and real GDP growth. Still large general government budget deficit of around 8% of GDP are also crowding out private sector borrowing.
Figure 2: Big Credit-GDP Gap Private Sector (actual v trend %)
Source: Datastream/Continuum Economics
India M3 growth has accelerated during 2026 (Figure 1), which partially reflects policy easing since 2025 by the RBI. However, the pick-up also reflects better credit supply, as the banking system is much healthier than the mid-2010’s (Figure 2) after a clean-up of NPL’s. This is allowing better access for households and businesses. India households remain with a low debt/GDP ratio, which reflects prior constraints. Rising GDP per capita is normally associated with a healthy rise in household debt/GDP as India moves towards a middle income country in the next decade. This should continue to see good money supply growth in India that supports nominal and real GDP growth.
Finally, Brazil M4 growth has picked up rather than slowdown, despite the ultra-restrictive stance of the BCB and high nominal and real policy rates. This is due to three reasons. Firstly, a still large general government deficit of 7.7% of GDP (IMF 2026) is boosting M4, as it includes federal securities held by funds. Secondly, Brazil financial system is going through a fintech wave that is helping to boost credit supply and availability. Thirdly, government fiscal support and inflation linked minimum wage increases are partially counterbalancing high policy rate levels for the household sector. These tailwinds for Brazil M4 growth are unlikely to slow into 2027 and this is one reason that the BCB could be cautious in the pace of easing. We see a further 25bps cut at the September 16 BCB meeting, but then the BCB going on hold during the presidential election and then resuming easing down to 12% by end 2027 (here).