UK GDP Outlook Update – Still Fragile With Surveys Negative
It is the relative norm for an economy to be offering disparate signals at any one juncture, if not actual conflicting ones. This is certainly the case in the UK currently, where upbeat Q1 GDP data of 0.6% q/q have been, confirmed and notably by a perkier consumer. Such shots of real growth are both common, but fleeting, thereby hardly ever flagging turning points. Moreover, the latest Q1 data came amidst downward revisions, suggesting a bare 0.1% q/q back to mid-2025, this incidentally being the q/q outlook we envisage for the rest of this year. Why the relative but persistent gloom? Well, as worsening business surveys encompass falling employment, a fragile housing market, squeezed real incomes, all results from a restrictive monetary (which may ease somewhat into 2027) but which will increasingly be accompanied by a tighter fiscal stance, where current budget rules are kept in place for now at least amid rising debt servicing costs. We see GDP averaging just under 1% both this year next, the upside being will this fragile outlook may reflect improved productivity growth!
Figure 1: GDP Growth Hardly Strong Even With Occasional Bulges?
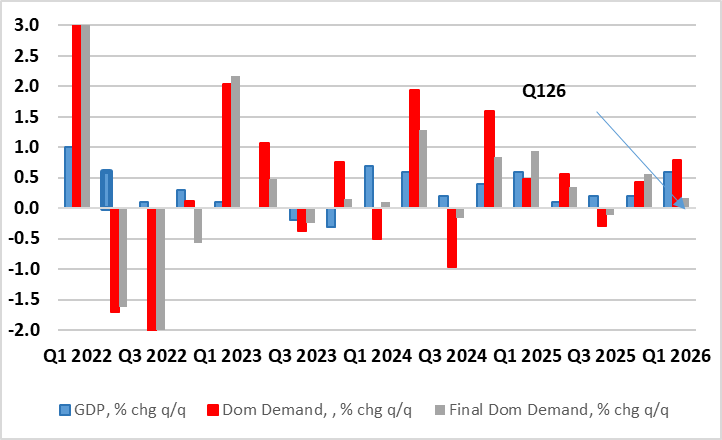
Source: ONS, CE
As we have highlighted previously, perhaps it is a supreme irony that just as business surveys suggest clear weakness already and ahead (Figure2), if not fresh contraction, the actual real economy has surprised on the upside, even now into the third month after the Middle East conflict started. Indeed, and in perspective, official GDP data suggest that since Labour took office in July 2024, the economy has grown a cumulative 2%-plus, ie over 1% per year. And providing yet more apparent signs of such economic resilience and, once again exceeding expectations, GDP grew by 0.3% m/m in March 2026, following growth of 0.4% in February and only fell back 0.1% in April. We think this is more an aberration than a better trend and partly a result of poor seasonal adjustments, meaning that we see May GDP falling back further, this chiming with both weak(er) business survey activity (see below) and employment signals and where what growth may actually have occurred likely to be short-lived boost in inventory building.
Figure 2: GDP Growth Hardly Strong and With Surveys Suggesting Increasing Downside Risks Ahead?
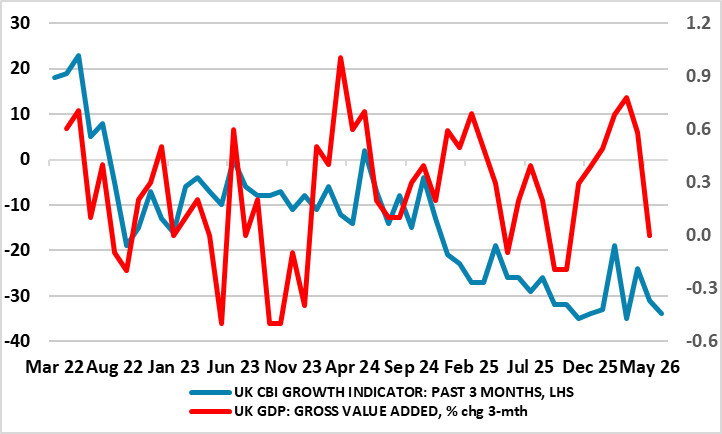
Source: ONS, CE, CBI
But those business surveys are telling only a similar tale, with the high-profile PMI composite consistent with apparent flat growth but those from the CBI painting a sorrier picture. The PMI data melds more into the more retail and business services CBI numbers once construction sector data are included (Figure 3). But there is still something awry with the PMI, namely the manner in which it treats aspects of manufacturing. In fact, at times like this, the manufacturing PMI interprets current adverse supply conditions as actually demand strength; hence that current long(er) delivery times are a function of solid demand, not supply. Hence, the manufacturing PMI is being boosted by a negative factor. This can be seen by making a PMI proxy from the PMI from CBI survey data but without the supply delivery component (Figure 3). And this shows a marked divergence in any assessment of the factory sector, all of which suggest it would be better placed to more emphasis on the CBI aggerate numbers, which continue to unravel even into June updates.
Figure 3: Alternative Surveys Offering Much Softer but Diverging Signals?
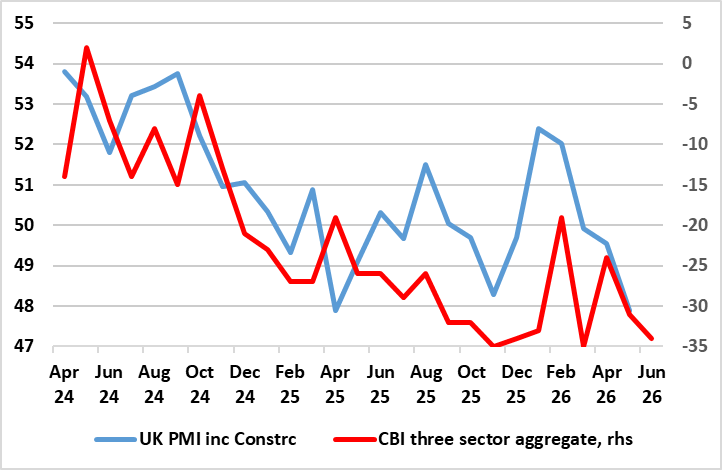
Source: Markit, CE, CBI
Even so, the PMI do offer important signals, providing monthly data on input and output costs for both services and manufacturing. The June survey stressed that input price inflation moderated for the second month running in June, though it remained elevated by historical standards. Rising input costs were linked to a number of factors, including higher prices for energy, chemicals, metals, IT hardware and shipping. Labour cost increases linked to government policy changes were also highlighted. Overall price pressures were stronger in the manufacturing sector, although in both segments, rates of inflation softened from the previous survey period.
Figure 4: Two Alternative Pictures of Manufacturing
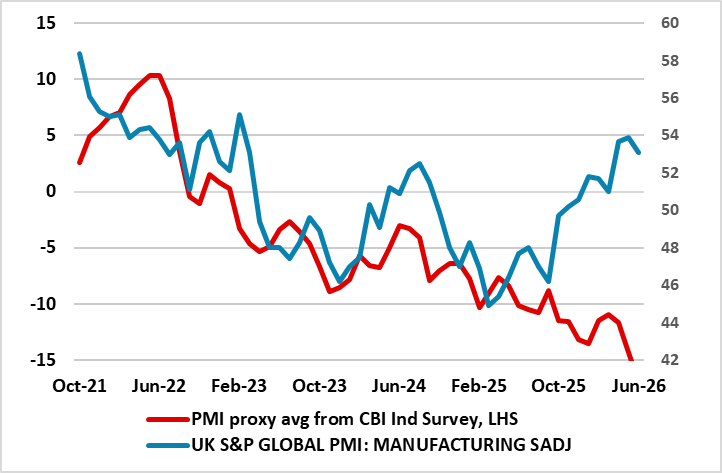
Source: Markit, CE, CBI
Private sector output charges continued to rise at the end of the second quarter, although like costs, the pace of inflation eased since May. Higher surcharges mainly reflected the pass-through of higher costs to customers, particularly at manufacturers, whilst some service providers noted fee cuts due to strong competition.
Figure 5: PMIs Point to Softer Cost Pressures -- Already?
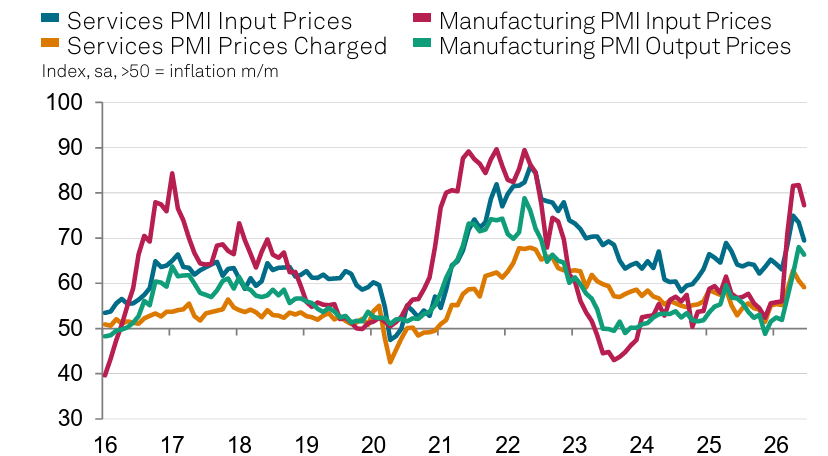
Source: Markit
Notably, Governor Bailey does seem to be suggesting that the BoE will be in no rush to hike. Regardless, we do not think this dubious GDP data will change most MPC thinking; Haskell recently mentioned some long-lasting skepticism about the GDP numbers. We very much siding with Bailey’s thinking, noting that even with the surprise momentum the UK may have had ahead of the conflict, it is still very modest compared to that seen four years ago when the Ukraine War precipitated the last energy price surge. This is especially so in regard to the consumer with clear implications for inflation risks. But with somewhat higher baseline energy price assumption, we no longer see any easing this year, instead deferring the easing we envisaged to 2027. Admittedly, rate hikes still seem to be the more likely policy response more implicit in BoE thinking, with some suggestion that without them then the tightening in financial condition seen of late would not be validated. We think this is misplaced, not least as some of the tightening in conditions reflects the likes of political and fiscal risks – NB the OECD is still penciling in the next policy move as a cut by late-year.