Commodities Outlook: The War and Its Reversal
The US-Iran memorandum marks a turn, but a fragile one. We attach 80% probability to the Strait of Hormuz reopening over June/July and staying open through 2027, and 20% to a second-half reclosure if Israel-Hezbollah tensions draw Iran back in (here). Most of the war premium has already unwound, and as supply returns faster than demand recovers, we see WTI at USD 80 by end-2026 and at USD 70 by end-2027.
Copper’s immediate outlook turns on a single decision, whether Washington imposes tariffs on refined copper. We narrowly expect it will not, which is an upside risk to our view. Further out, we doubt the widely anticipated shortage, seeing a genuine deficit as more of a 2028 story, while demand rotates toward electrification and AI. We expect prices to be broadly capped near USD 13,000 at end-2026, rising toward USD 14,000 in 2027 as the market tightens.
Gold did the opposite of what its safe haven billing implies, falling roughly a quarter from its January record during the war. The cause was not real yields but a rush for dollars and liquidity, as some investors sold while central banks kept buying. As the conflict resolves, we think that selling will likely reverse and the structural central bank bid sets a floor. We expect a measured recovery to USD 4,500 by end-2026 and USD 4,600 by end-2027, without retesting the record.
Oil: Two Paths Through the Strait
The US-Iran memorandum of understanding (MOU) marked a long-awaited turning point in the conflict. The MOU, which paves the way for the reopening of the Strait of Hormuz, has already eased pressure on global markets. If there is one lesson from the past four months, however, it is how quickly the picture can change, for better or worse. For that reason, rather than anchoring to a single forecast, we set out two scenarios for developments in the Middle East and how each would shape the flow of oil through the Strait, and therefore, prices (here).
In our baseline, to which we attach an 80% probability, the current impasse is resolved and the Strait reopens over June/July, remaining open through 2026 and 2027. In our alternative scenario, which carries the remaining 20%, the Strait reopens on the same timeline, but a renewed escalation between Israel and Hezbollah later in the year leads Iran to threaten, or to carry out, a temporary reclosure during the second half, much as the disruption just after the MOU signing.
Under the baseline, the reopening removes the large geopolitical risk premium that has dominated pricing since late February. Much of that adjustment has already happened. WTI has fallen from a wartime peak near USD 110 to around USD 75, erasing most of the gains built up during the conflict. Our central expectation is that as transit is fully restored, the return of supply outpaces the recovery in demand, holding prices a little above their pre-conflict level through the remainder of 2026 and easing them gradually back toward it over the course of 2027, with the rebuilding of depleted inventories putting a floor under the market. We stress that open does not mean normal. Several frictions point to a recovery measured in months. Iran must first remove tactical and military obstacles and de-mine the waterway. Shipowners will then want reassurance that the agreement holds, and that vessels and crews can transit safely, before sending their ships back through, and insurance cover will be slow to follow. The dislocation in vessel positioning and trade routes built up over four months of closure will itself take time to unwind.
Supply returns in three streams and at three different speeds. The first is the recovery of production from facilities damaged in the conflict. Restoring them will take time, with industry leaders pointing to a full recovery that could extend into 2027. The second, and the more important driver, is stranded rather than damaged capacity. The Gulf producers have been unable to export through a closed Strait; indeed, the loss of those exports pulled OPEC+ output as a whole down to 33.2 mbd in April from 42.8 mbd in February. Much of that trapped oil backed up into storage during the closure, and as transit clears both the stranded capacity and the accumulated stock will become deliverable again. This, rather than the OPEC+ quota increases that draw the headlines, is what will actually drive supply back to the market. OPEC+ has continued to raise its targets, unwinding the 1.65 mbd of cuts it first agreed in April 2023, a process running through H2 2026, but with Gulf members physically unable to move barrels while the Strait was closed, those increases have been largely symbolic. The third is continued growth from producers outside OPEC+, with the U.S., Brazil and Guyana adding barrels through the forecast period.
Depleted inventories provide the floor. We have argued that one reason prices did not hold above USD 100 for longer was the scale of the drawdown in global commercial and strategic stocks, and that drawdown has been severe. The U.S. Strategic Petroleum Reserve (SPR) has fallen to its lowest level since 1983; commercial crude sits roughly 5% below its five-year average, with commercial stocks at the Cushing hub down to operationally low levels near 20 mb. Total U.S. stocks, including the SPR, have fallen by 96.25 mb since the start of the Iran war (Figure 1). Globally, OECD inventories are on track to fall to roughly 50 days of demand cover by the end of 2026, the fewest in a dataset that begins in 2003. This depletion amplified the upside through the conflict; however, as prices ease it becomes a source of support, since lower prices incentivize the rebuilding of commercial stocks, and the eventual refilling of the SPR represents a multi-quarter and price-supportive bid that has yet to materialize.
The macro backdrop adds a mild tailwind. We expect the Fed to hold rates for the remainder of 2026, a better setting than the prior risk of a hike, followed by two 25bp cuts in 2027. A steadier rate path support consumption at the margin, and the northern-hemisphere summer driving and travel season adds a seasonal pull through the third quarter. There is also a more structural source of support in China, where the growth in oil demand has shifted from transport fuels into petrochemicals. Almost all of China's demand growth this year comes from petrochemical feedstocks rather than road fuels. Still, working the other way, the conflict in Iran has accelerated the switch to EVs, which displaces gasoline demand, particularly in China.
Figure 1: U.S. Stocks of Crude Oil, Million Barrels (Including SPR)
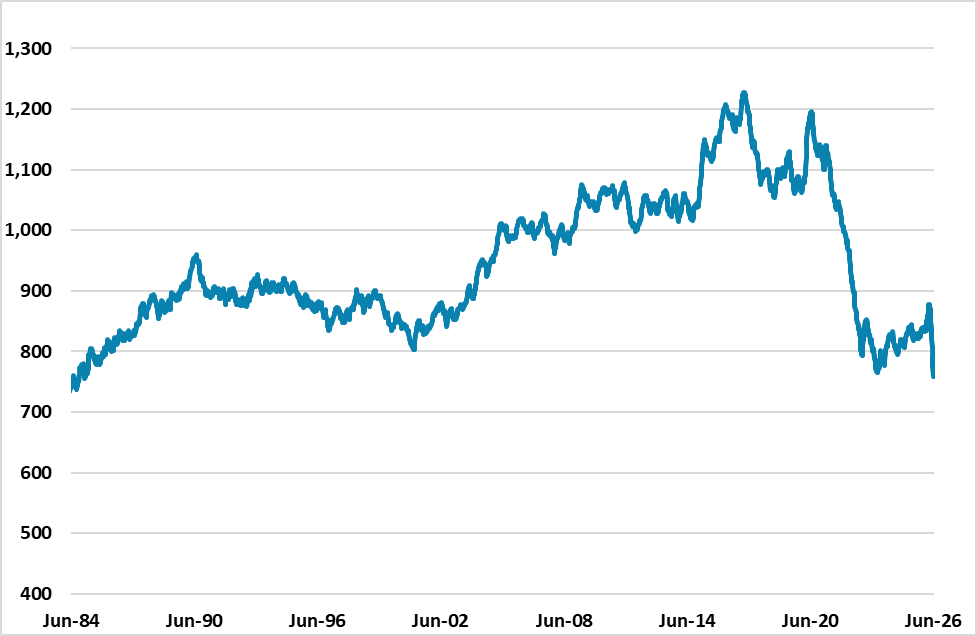
Source: EIA, Continuum Economics
Netting these forces, most of the war premium has already unwound, and we expect what remains to ease gradually as transit normalizes and supply returns faster than demand recovers, with inventory rebuilding preventing a deeper fall. From near USD 100 at the start of the year, we see WTI easing to a USD 70-90 range by Q4 2026 and at USD 80 by the end of the year, and returning toward its level before the conflict through 2027, settling into a USD 60-80 range and at USD 70 by end-2027.
Our alternative scenario shares this long run anchor but takes a more volatile path through H2 2026. The MOU settles the immediate disruption without resolving the underlying disputes beneath it, leaving the truce fragile. In this scenario, an escalation between Israel and Hezbollah draws Iran in and prompts Tehran to threaten, or briefly to carry out, a renewed closure of the Strait during the second half of the year. The mechanics mirror the original shock, though to on a temporary basis. The price implication is concentrated in H2 2026. We would expect the renewed premium to lift WTI into a USD 70-100 range by Q4, ending 2026 near USD 85, above the baseline path. The reclosure is short-lived, however, and as tensions ease and transit is restored a second time, prices converge again with the baseline through 2027 and ending 2027 near USD 70.
Copper: Waiting on Washington
By the end of June, the U.S. Commerce Secretary is due to deliver a recommendation to President Trump on whether to impose tariffs on refined copper, ahead of a proposed 15% duty due to take effect in January 2027 and rising to 30% from January 2028. We see this as a close call, but on balance we expect tariffs not to be imposed at this stage. Two factors support that view: the President's declining political capital, and the additional inflationary pressure a copper tariff would impose at a time when the Iran conflict has already lifted U.S. inflation. The market, by contrast, has largely been pricing in tariffs, as reflected in the accumulation of metal in U.S. warehouses, where COMEX stocks have climbed to a record above 650,000 metric tons as traders front-run the duty. We treat the potential imposition as a meaningful upside risk for prices.
The decision matters because it governs whether that accumulated U.S. stock unwinds. Traders have moved substantial amounts of refined copper into U.S. warehouses in anticipation of tariffs, tightening availability elsewhere and supporting the global prices. If the tariff is imposed, the stock stays in place and the dislocation persists, with price resuming its climb. If it is not, we think part of the accumulated stock would gradually be released to the rest of the world, loosening ex U.S. tightness and pulling prices down as the dislocation normalizes. A third possibility, which we regard as realistic given the administration's preoccupation with Iran, is that the decision is delayed. A delay would keep the threat alive and the stock in place, leaving prices supported much as they would be under actual tariff imposition. However, as each deferral erodes the credibility of an eventual tariff, the pace of additional accumulation would likely slow.
A powerful narrative holds that copper faces a significant shortage as a run of mine disruptions, from Grasberg in Indonesia to operations in the Democratic Republic of the Congo and output downgrades in Chile, tightens the market. We do not dispute these disruptions, but we are skeptical of the severity of the shortage thesis, which has been overhyped for several quarters. Two considerations underpin our caution. The first is that much of the visible tightness is not genuine scarcity but the regional dislocation described above, metal relocated rather than consumed. As that distortion fades, the apparent tightness should ease with it. The second is that the market retains its safety valves; indeed, when copper becomes too expensive relative to aluminum, manufacturers switch to aluminum in wiring and cables. Both responses cap rallies and we see a genuine deficit as more of a 2028 story than a 2026 or 2027 one.
Demand is best understood through the changing composition of China’s consumption. China remains the dominant force in the market, but the industries driving its demand have rotated. Where the property and the consumer once led, the marginal driver is now electrification and AI infrastructure. That rotation resolves an apparent contradiction, namely that China’s copper demand has held up even as the old engine has stalled. The property sector has yet to bottom, and household consumption remains weak amid soft wage growth, yet these new sources of demand have more than replaced the old. Grid and power infrastructure alone are projected to drive more than 60% of copper demand growth through 2030, according to Goldman Sachs, with the construction of AI data centers adding further support. The result is that the floor under China’s copper demand sits higher than a focus on property alone would suggest.
On balance, we expect copper to remain broadly capped in 2026 before rising in 2027. We see prices ending 2026 near USD 13,000, a touch below current levels around USD 13,500, held in check by the most likely non arrival of U.S. tariffs and by the absence of the severe shortage the market has feared. Into 2027 we expect a move toward USD 14,000, as the demand rotation reasserts itself, the macro backdrop turns supportive with Fed easing, and the market begins to price the approaching 2028 deficit. That tightening starts to bite in 2027, though not yet significantly, which is why we see the move higher as measured rather than a return to the volatility of the conflict period.
Gold: A Safe Haven, Sold for Cash
Gold has two types of buyers who behave very differently, central banks who buy steadily for the long term whatever the market is doing, and speculative investors who buy it for price gains but sell it for cash when they suddenly need money (fund managers are on a structural increasing trend as a hedge against an equity crash). As the oil shock sent everyone rushing for dollars, speculative investors sold while central banks kept buying, and gold fell from its peak, the opposite of what a safe haven is supposed to do. That division is the key to the forecast; indeed, as the conflict resolves, investors who sold will likely turn into buyers again, while central banks go on providing a floor.
Gold reached a record near USD 5,600 in late January, before the war began, driven by forces that had driven it for two years. Record central bank buying, anxiety over fiscal deficits and debt, fund manager diversification and speculative interest. The conflict then knocked it down to around USD 4,250, even though a Middle East war is precisely the kind of event its safe haven billing is built for. For two decades gold moved inversely with real yields, but that relationship broke after 2022, when gold rose to fresh highs even as real yields stayed firmly positive, as unprecedented central bank buying replaced investor flows as the marginal driver of the price. What sent gold down during the conflict was not the return of that relationship but a rush for dollars and liquidity. As the oil shock spread, investors sold the most liquid form of their holdings, with gold ETFs seeing record outflows in March that erased the inflows of January and February, even as central banks bought 244 tones over the quarter.
The depth of the fall also owed something to the steepness of the climb that preceded it. Gold's run from around USD 3,000 in early 2024 to its January peak was near vertical; moreover, a rally that steep carries a layer of momentum and speculative positioning on top of the structural bid. A liquidity event flushes that layer out, which is both why the correction was so abrupt and why the January peak is unlikely to be regained quickly.
As the Iran conflict winds down under our baseline, that liquidity drag reverses, and the structural anchor returns. That support is central bank demand, and the evidence firmly supports this. The World Gold Council's 2026 reserve survey, published in June, found that 89% of reserve managers expect global official gold holdings to rise over the next 12 months (Figure 2), a record 45% expect their own reserves to increase, and only 1% anticipate a decline, while 74% expect dollar holdings to fall as a share of reserves over the next five years. We expect this demand to persist, though at a slower pace than the 2022 peak. Reported buying cooled early in 2026, yet actual buying is estimated nearer 244 tones once unreported flows are included, led by a sharp rise in China’s imports (which could be unreported gold reserve accumulation). The bid is structural and still growing, which puts a floor under gold without driving it to new records, since the pace of buying has slowed.
Figure 2: How central banks expect their gold reserves to change over the next 12 months
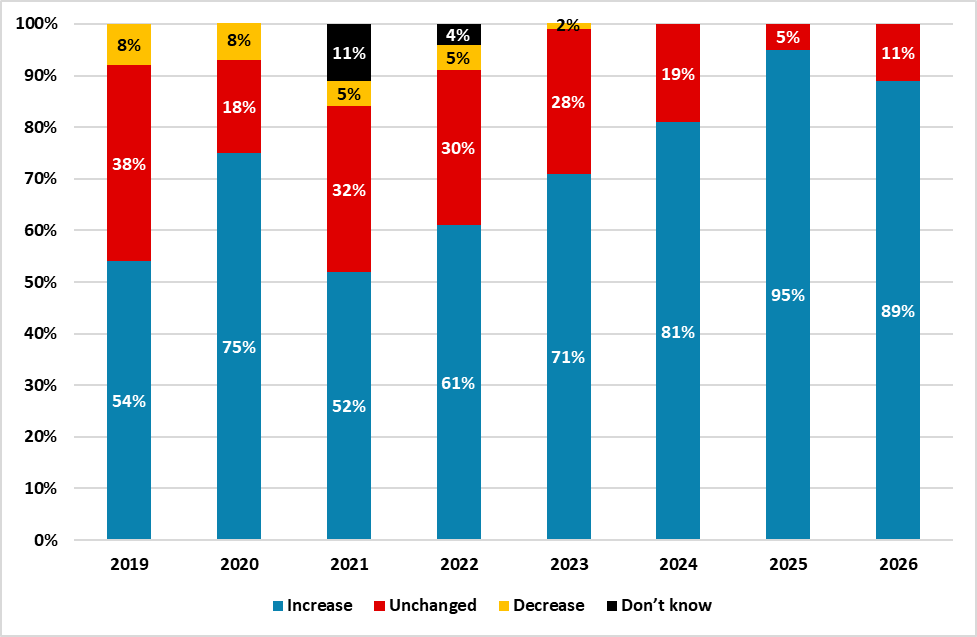
Source: World Gold Council, YouGov, Continuum Economics
The cyclical tailwind comes from the reversal of investors’ liquidity preference that drove the fall. As the conflict ends, the March and May ETF outflows should slowly turn back to inflows, restoring the financialized demand that central banks alone could not replace.
Two factors nonetheless cap the upside. The first is that same deceleration in official buying, still a floor under the market, but no longer the engine of new records it was three years ago. The second is the fragility the conflict has just exposed. Gold's sharp fall demonstrated that when some investors need liquidity, the metal is sold, and that vulnerability to profit taking persists as long as speculative positioning can be unwound in a stress episode. We therefore expect gold to recover without retesting its highs and we forecast it at USD 4,500 by end-2026 and USD 4,600 by end-2027, with the structural bid setting the floor and the two ceiling factors limiting the climb.
The main risk to our central view is that our alternative scenario for the Iran conflict materializes in H2 2026. A fresh escalation would revive a smaller rush for liquidity that drove the March selloff, with speculative investors again selling gold to raise dollars rather than buying for price gains. Any renewed U.S. inflation pressure would compound the effect, reviving the case for a tighter stance from the Fed, which would keep the dollar firmer and increase the opportunity cost of holding gold. Together these would stall, and possibly reverse, the modest recovery we expect.