U.S. July and revised Q2 Core PCE Prices on the firm side, Income and Spending also exceed expectations
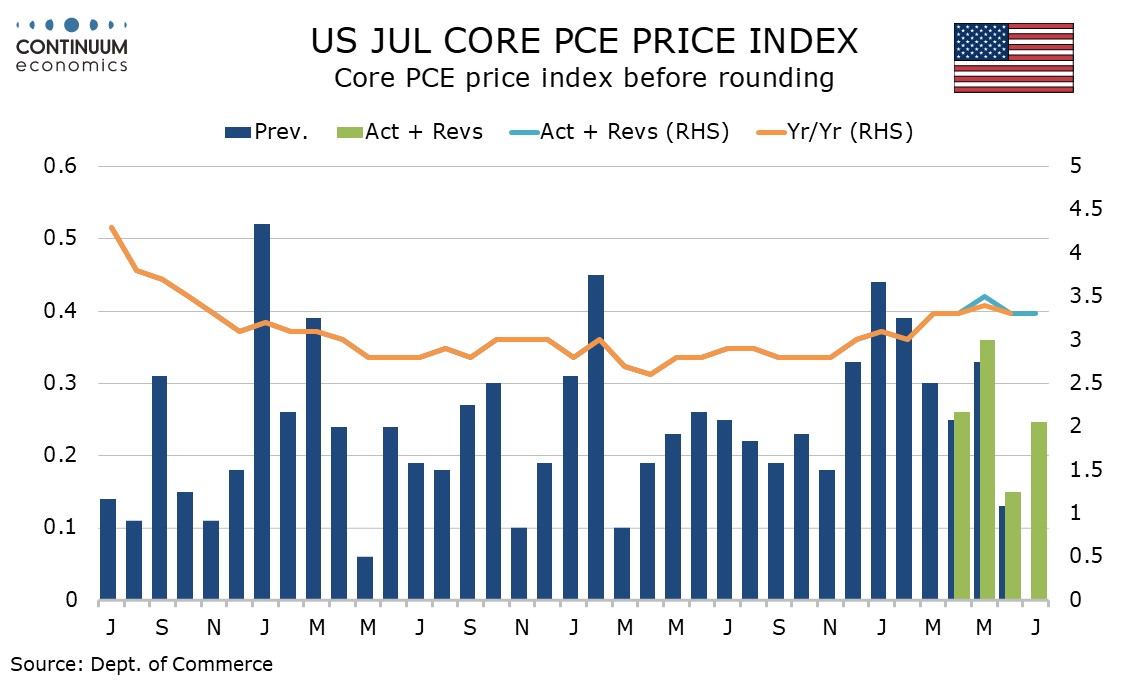
While July’s core PCE price index came in at 0.2% as expected, before rounding the rise was 0.246%. Q2’s core PCE price index was revised up to 3.6% annualized from 3.4%, making the data a modest disappointment, which will sustain Fed inflationary worries, though is not quite enough to make a September tightening likely. July personal income and spending were also on the firm side of expectations. Q2 GDP revisions and July durable goods orders data were mixed.
June core PCE prices were revised to 0.147% from 0.13%, May to 0.36% from 0.33% and April to 0.26% from a low 0.25%, meaning that the April and May revisions were visible before rounding, but June’s was not quite. Yr/yr core PCE prices at 3.3% match the paces of June, March and April, while May was revised up to 3.5% from 3.4%. All are clearly above the Fed’s 2.0% target.
Overall PCE prices were stronger than expected with a 0.2% increase, though the rise was only 0.16% before rounding, meaning the surprise came in the core rate rather than food or energy. Overall yr/yr PCE prices at 3.7% are unchanged from June, but down from 4.1% in May.
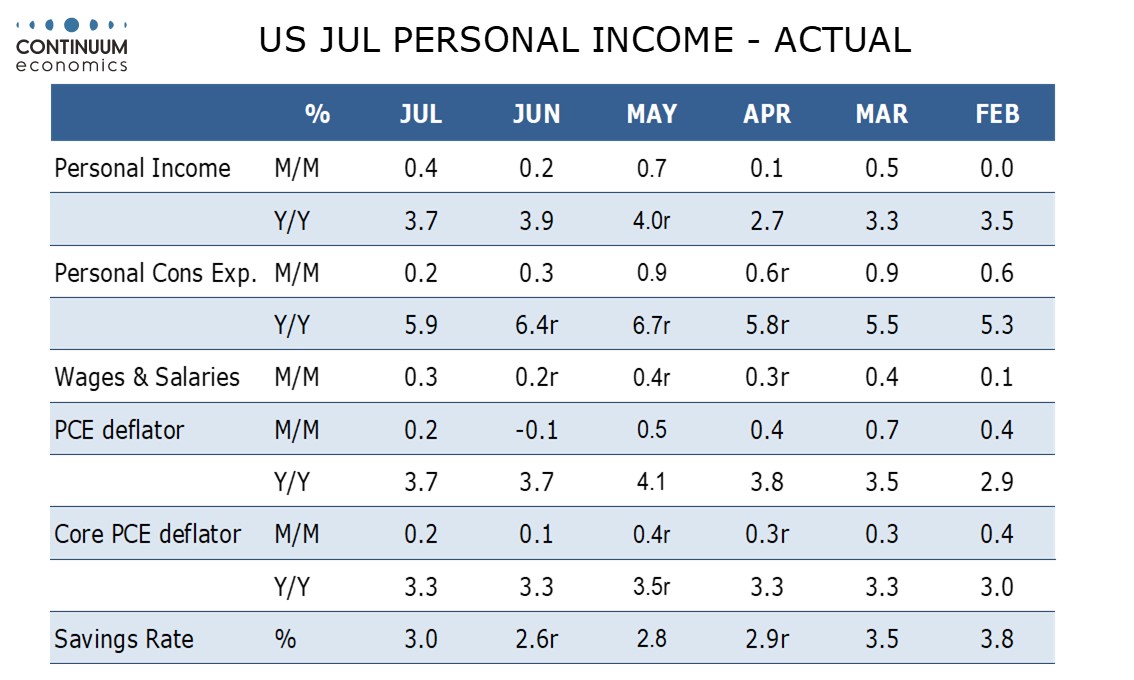
July personal income rose a stronger than expected 0.4%, with minimal back month revisions. Wages and salaries rose by 0.3% meaning a strong month from other components of personal income, which was reasonably broad based, rather than being due to a one-off bounce in a single component. Real disposable income rose by 0.4%, a third straight rise to follow three straight declines.
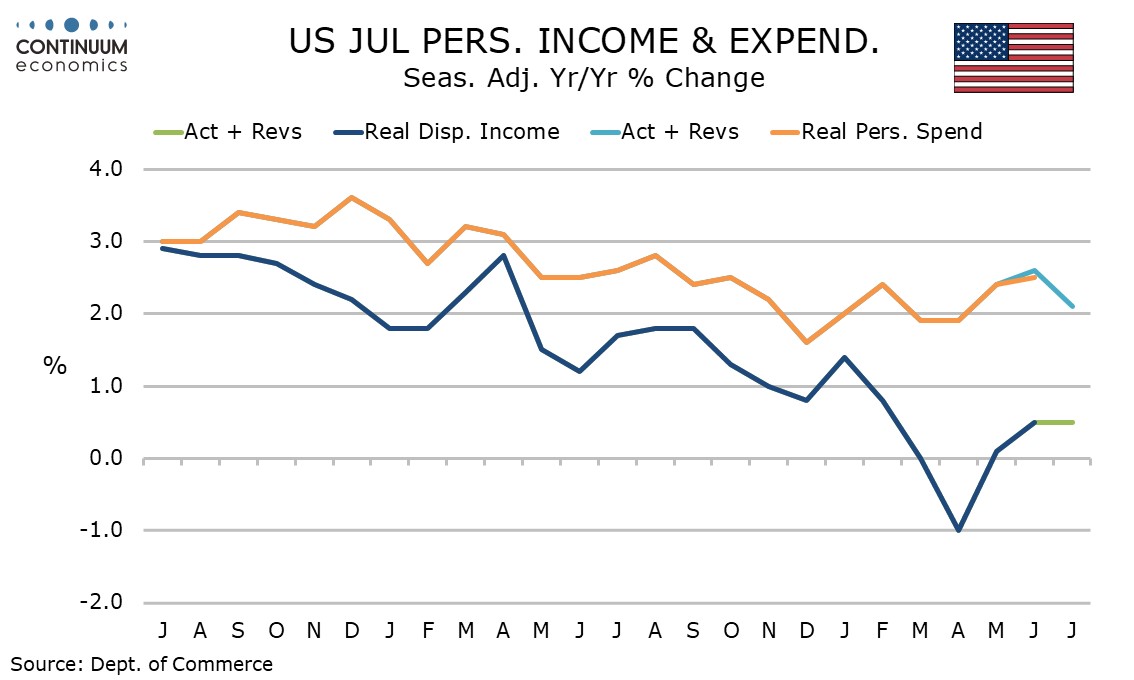
Personal spending underperformed personal income with a rise of 0.2% (unchanged in real terms), lifting the savings ratio to 3.0% from 2.6%. Retail sales were negative in both nominal and real terms as weak retail sales data had implied, but services increased by 0.6% in nominal and 0.4% in real terms. Q2 services consumption was revised significantly higher, to 3.1% from 2.2%, with the monthly gain in each month of Q2 now 0.4% in real terms. Fears of a consumer slowdown generated by July retail sales weakness will ease somewhat on this data.
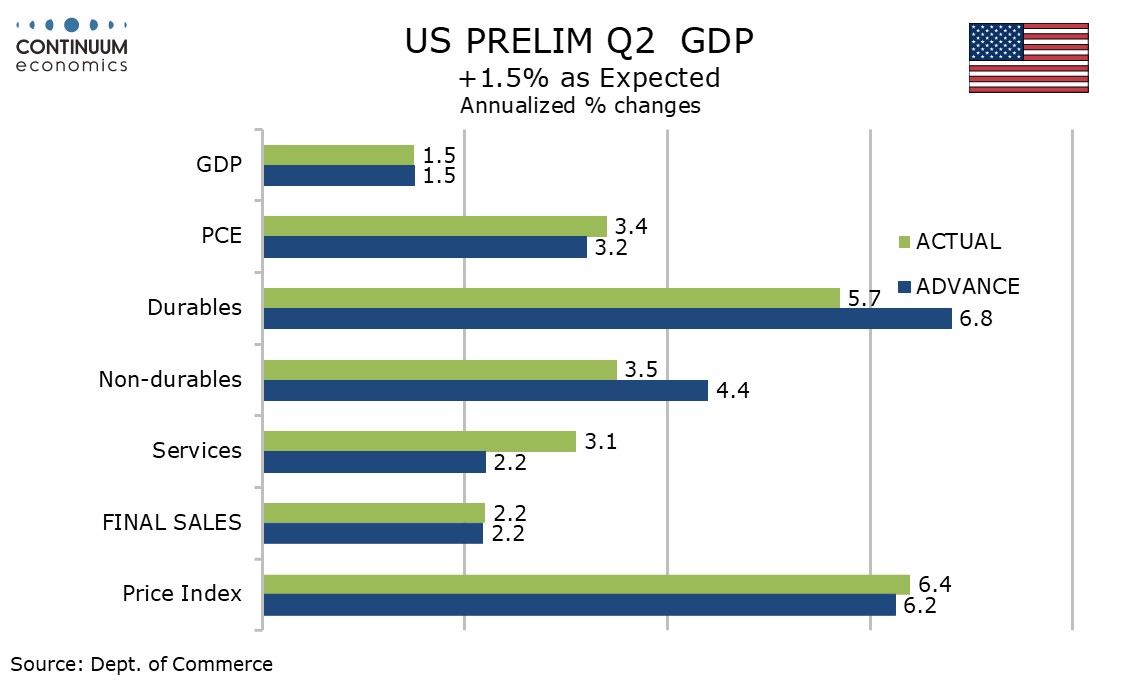
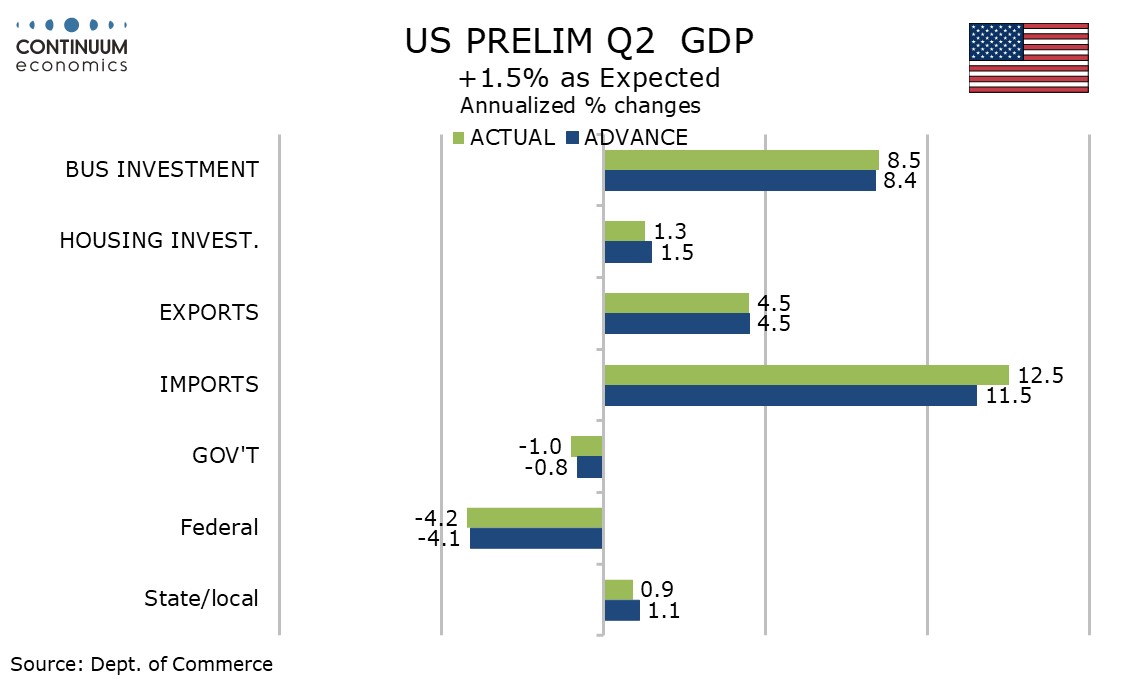
Despite downward revisions to retail, Q2 consumer spending was revised up to a healthy 3.4% from 3.2%, though overall GDP was unrevised at 1,5%. Then main negative in the GDP revision was net exports, on an upward revision to imports. Inventories, housing and government also saw modest negative revisions. Business investment saw structures revised higher and equipment revised lower.
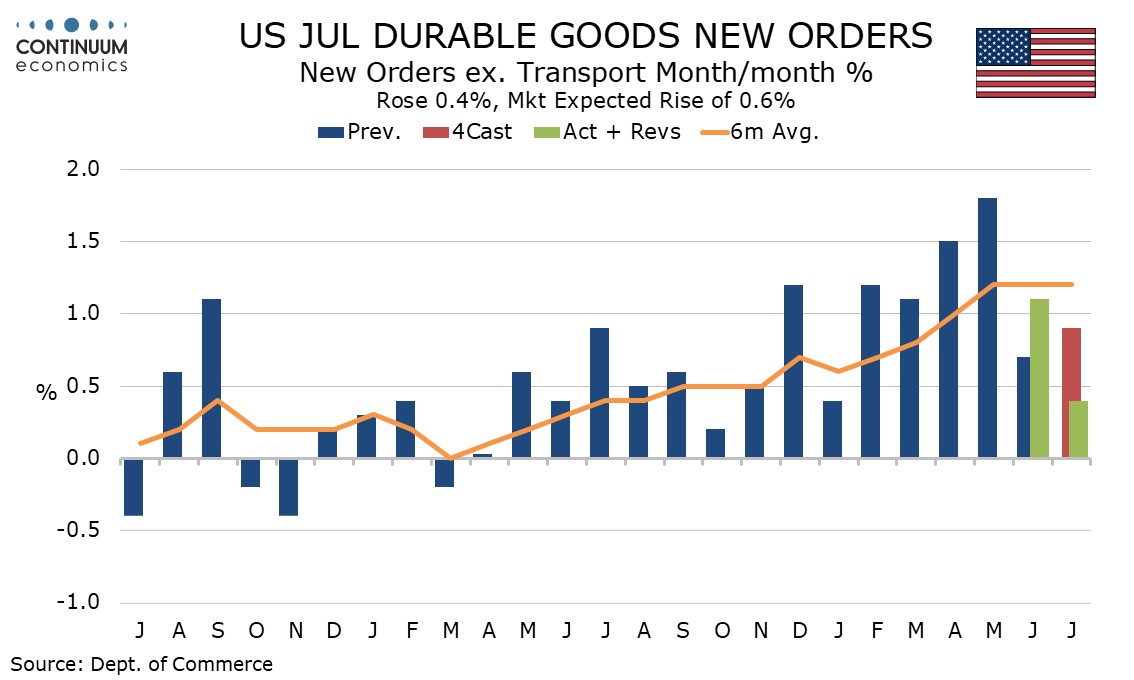
A weaker than expected 0.4% rise in July durable goods orders ex transport also makes the equipment investment picture look a little less positive, the modest rise coming after five straight gains of at least 1.0%, but one month does not make a trend.
Non-defense capital orders ex aircraft were even more subdued, rising by only 0.2%. Shipments in the sector were firm however, up by 1.4%, and a 0.4% rise in inventories is also supportive for Q3 GDP.
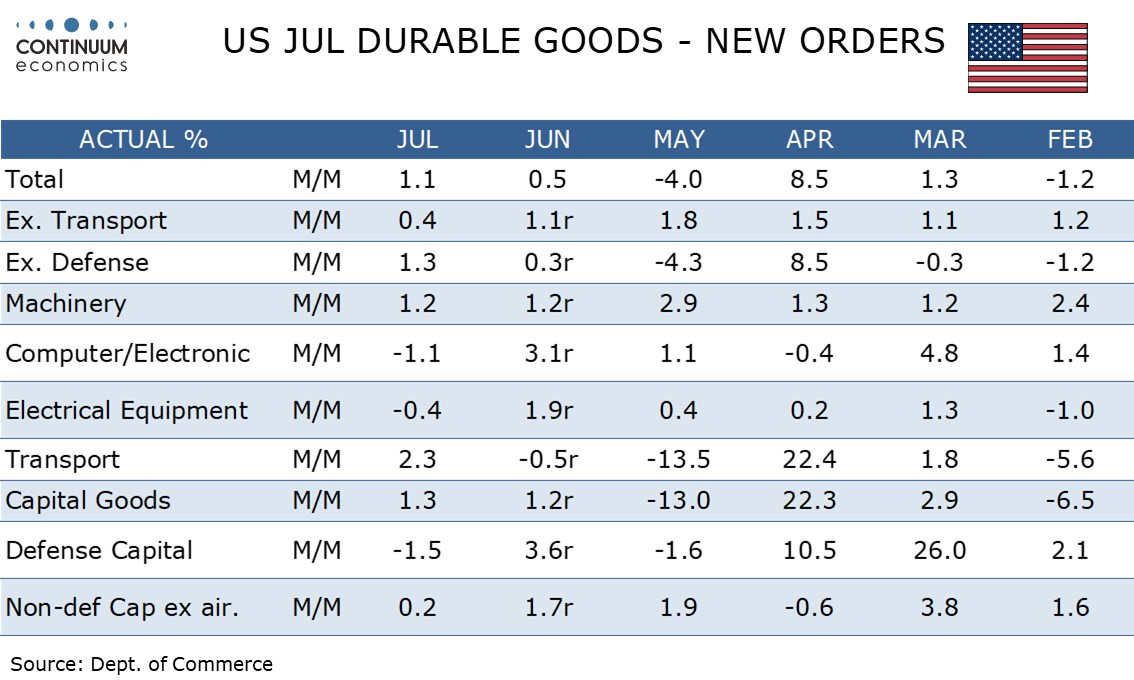
Overall durable goods orders were slightly stronger than expected with a rise of 1.1%, and ex defense stronger still at 1.3% as defense saw a small correction from recent strength. Transport was supported by gains in autos and aircraft, both more than fully reversing dips in June, though the gains were moderate.