U.S. GDP, Income, Spending and PCE Price revisions mostly encouraging, but Trade Deficit is rising
The final Q2 GDP report and August’s personal income and spending data are notable for historical revisions going back to 2021. The news in the revisions is generally encouraging, with upward revisions to GDP and real disposable income but downward revisions to PCE prices, led by non-market prices. A wider than expected August advance trade deficit of $132.6bn from $118.9bn, led by surging imports, will however take something off what have been increasingly positive expectations for Q3 GDP.
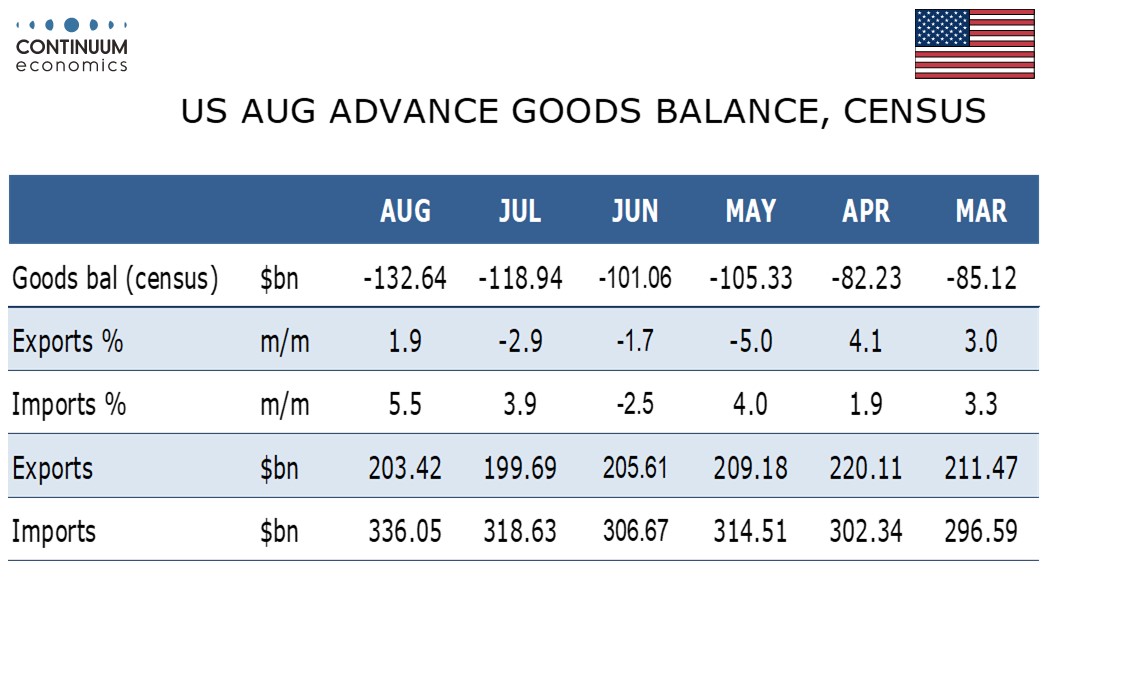
The advance goods trade data shows exports up by 1.9% after three straight declines while imports surged by 5.5% to extend a 3.9% July increase. In both series industrial supplies saw particularly sharp gains of 8.3% for exports and 16.6% for imports. Elsewhere exports were mostly weak while imports were mostly strong.
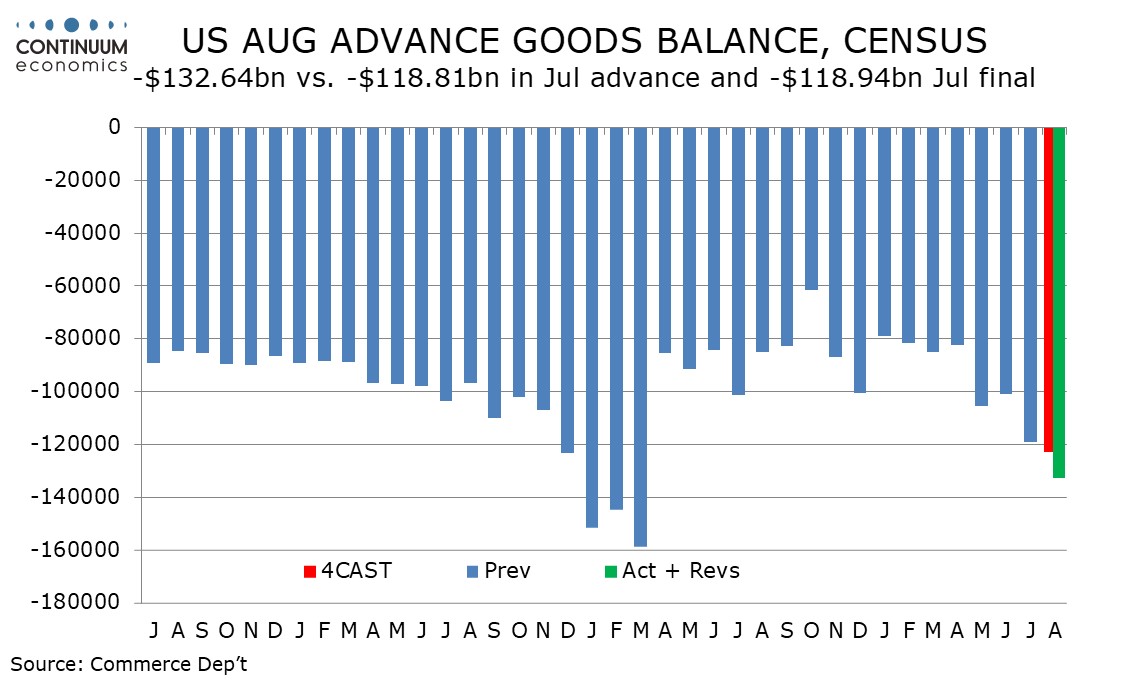
The deficit is now on a rising trend led by strength in imports which is related to strength in US demand, business investment in particular. While still below the elevated pre-tariff deficits of Q1 2025 the deficit has now moved above the levels seen in late 2024. Advance August inventory data was mixed with limited GDP implications, wholesale quite firm at 0.7%, but retail increasing by only 0.3%.
August core PCE prices with a 0.2% increase were a little softer than expected though the gain was 0.247% before rounding. July was revised significantly lower to 0.13% from 0.25% and yr/yr growth now stands at 3.0% for a third straight month. Before the revisions June and July both stood at 3.3% yr/yr. For Q2 core PCE prices were revised to 3.3% from 3.6% annualized. August’s 3-month annualized pace is only 2.4%.
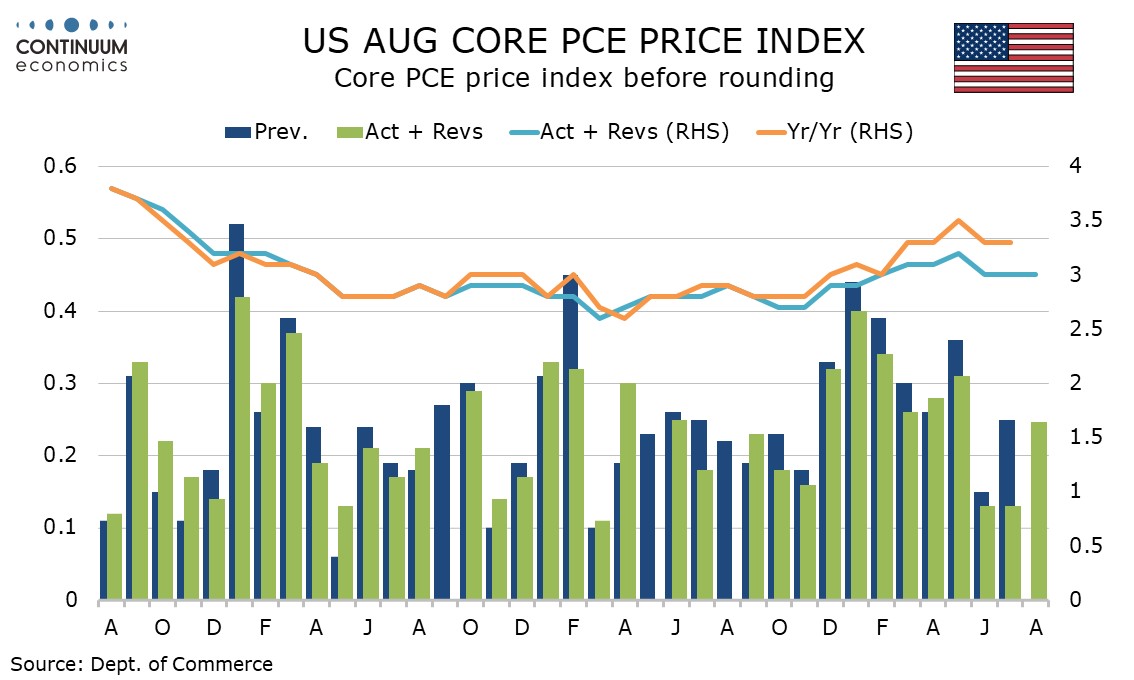
Market based core PCE prices also stand at 3.0% yr/yr and here July saw only a marginal revision to 2.9% from 3.0%. Fed’s Waller had suggested that revisions to non-market prices would be negative and would lead core PCE price revisions. Overall PCE prices rose by 0.3% on the month with yr/yr growth at 3.4% matching a revised July, which was revised down from 3.7%.
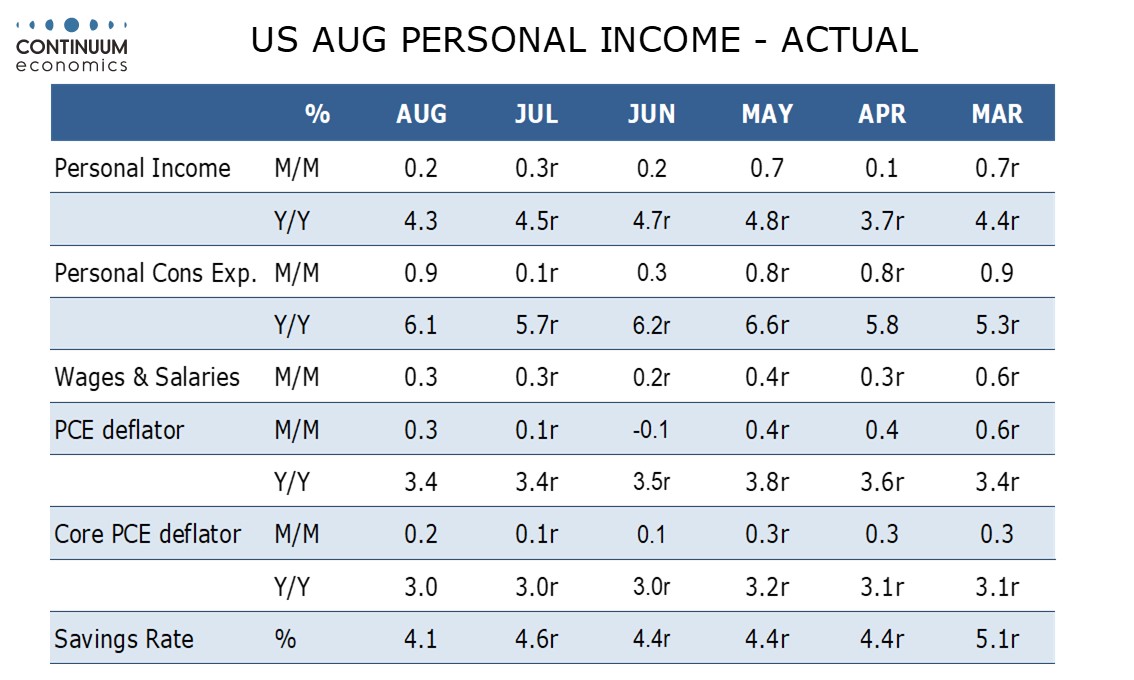
Personal income saw a weaker than expected 0.2% August increase with wages and salaries weaker than August’s payroll had implied at 0.3%. This was well below a 0.9% rise in personal spending which confirmed strength in August retail sales while seeing services up by 0.5% (and a moderate 0.2% in real terms).
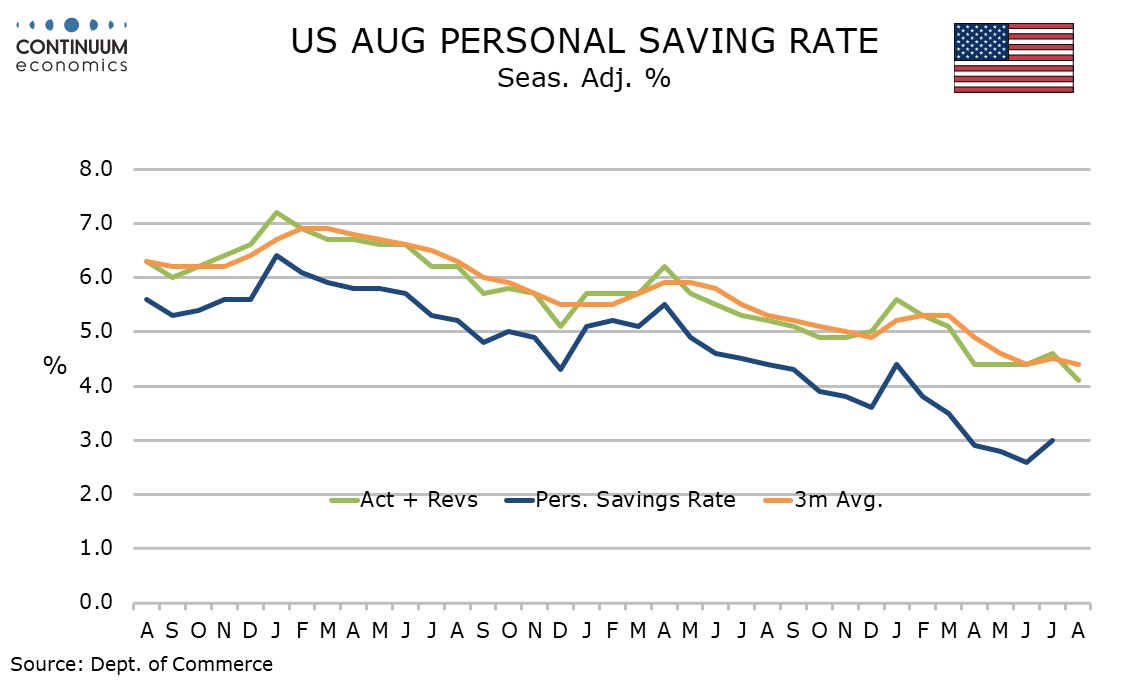
Real disposable income was unchanged and real personal spending up by 0.6%. This saw savings slip to 4.1% from 4.6% but July savings were revised significantly higher from 3.0%. Savings are still on a slowing trend but the significant upward revisions make the consumer look less vulnerable than previously appeared to be the case.
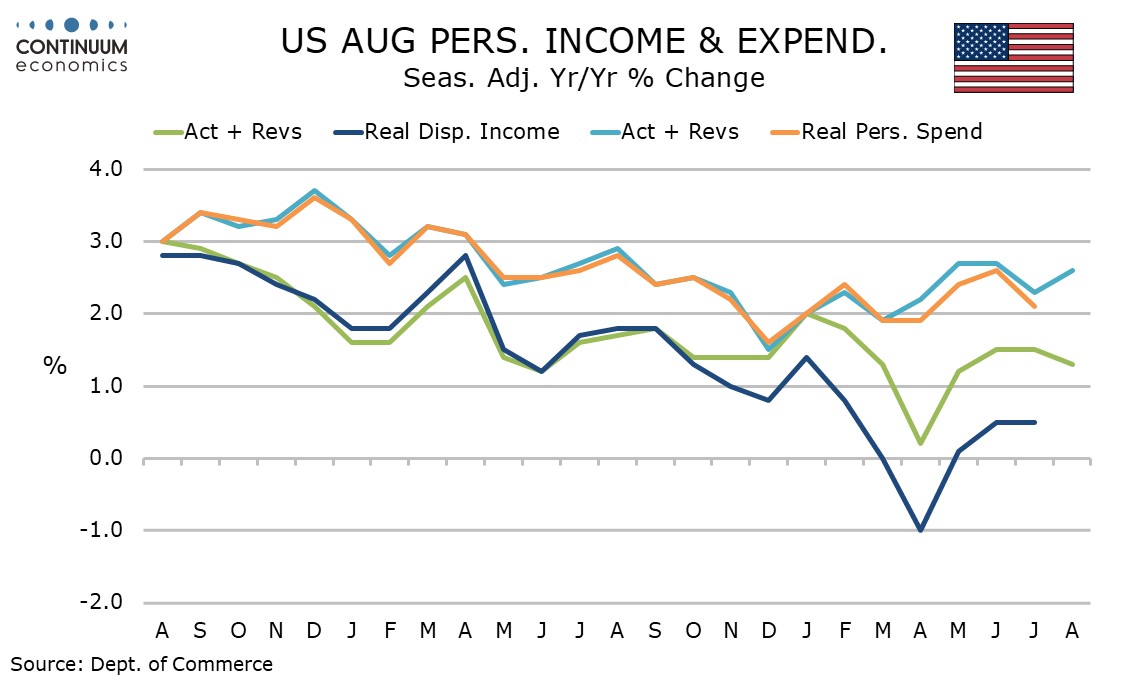
Real disposable income is now up by 1.3% yr/yr compared to 2.6% for real personal spending. In Q2 real disposable income is now up 1.0% yr/yr versus a previous -0.1%, while real personal spending is up 2.5% yr/yr, a modest upward revision from a previous estimate of 2.3%.
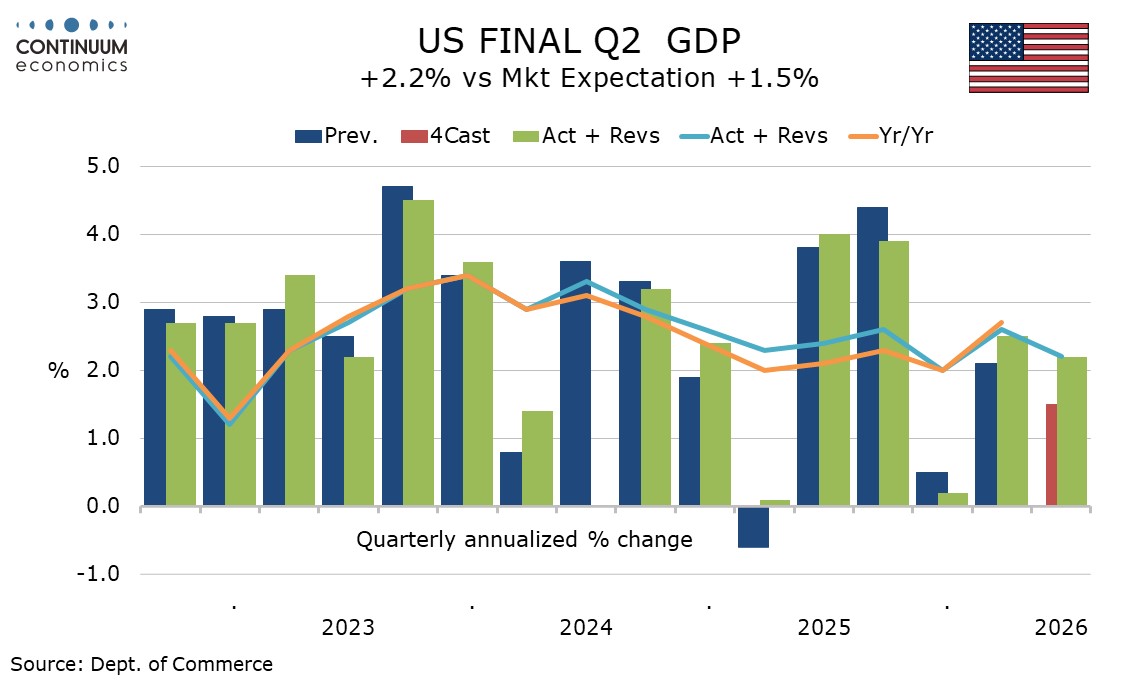
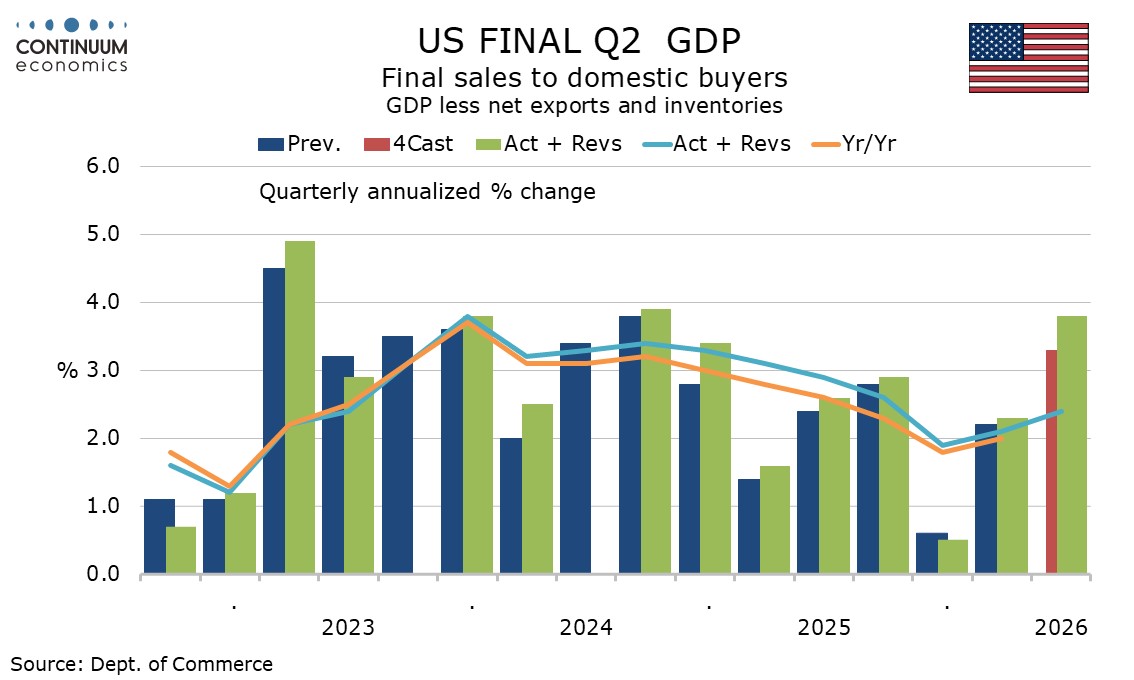
Q2 GDP saw a significant upward revision to 2.2% from 1.5%. Consumer spending as revised to 3.8% from 3.4%, business investment to 9.0% from 8.5%, housing to 2.8% from 1.3% and government to -0.1% from -1.0%. Final sales to domestic buyers (GDP less inventories and net exports) were revised to 3.8% from 3.3%.
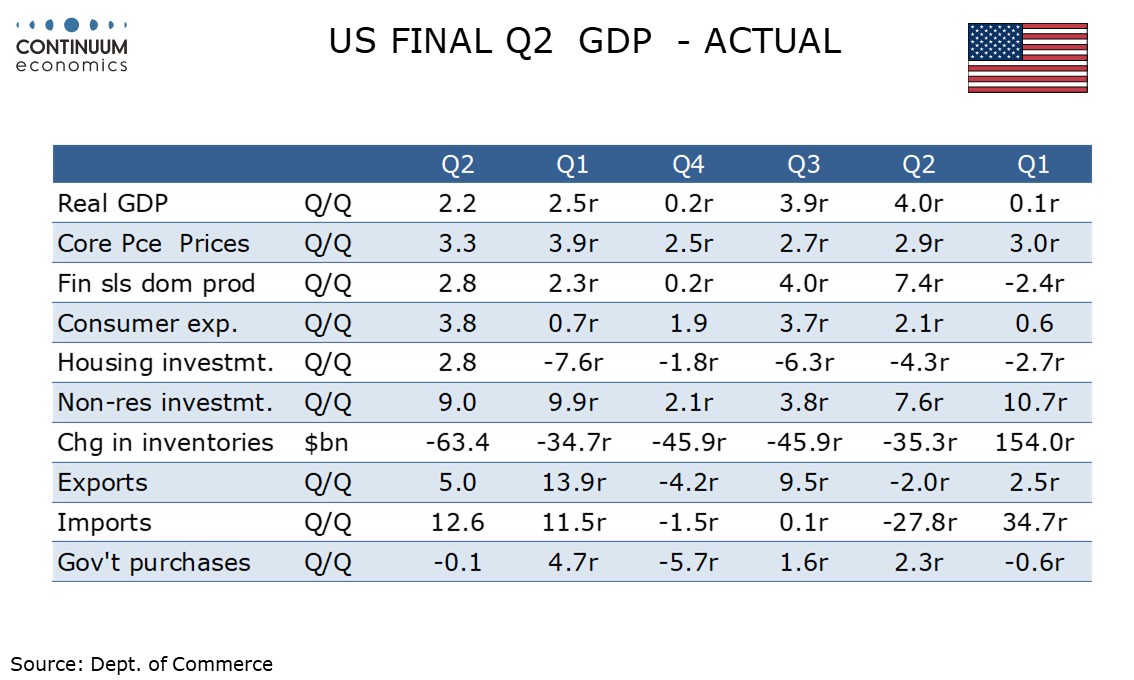
Q1 GDP was revised to 2.5% from 2.1%. Going further back GDP revisions were mostly modestly positive (by around 0.2%) in 2025 and 2024, though the second half of 2025 was revised lower.