U.S. September Retail Sales and PPI, October Philly Fed and Empire State, Initial Claims - Generally strong
The latest set of US data is on the firm side of expectations, September PPI at 1.3% overall and 0.7% ex food and energy, September retail sales at 0.8%, 0.9% ex autos. Underlying gains of 0.5% for PPI ex food energy and trade and 0.2% for retail sales ex autos and gasoline are less firm but far from weak. Initial claims, Philly Fed and Empire State data are all consistent with a firm economy too.
The PPI showed a stronger than expected energy gain of 10.8%, stronger even than March’s 10.5%, with gasoline, home heating oil and diesel all up by near 20% on the month. Food was also firm at 1.2% after three straight declines.
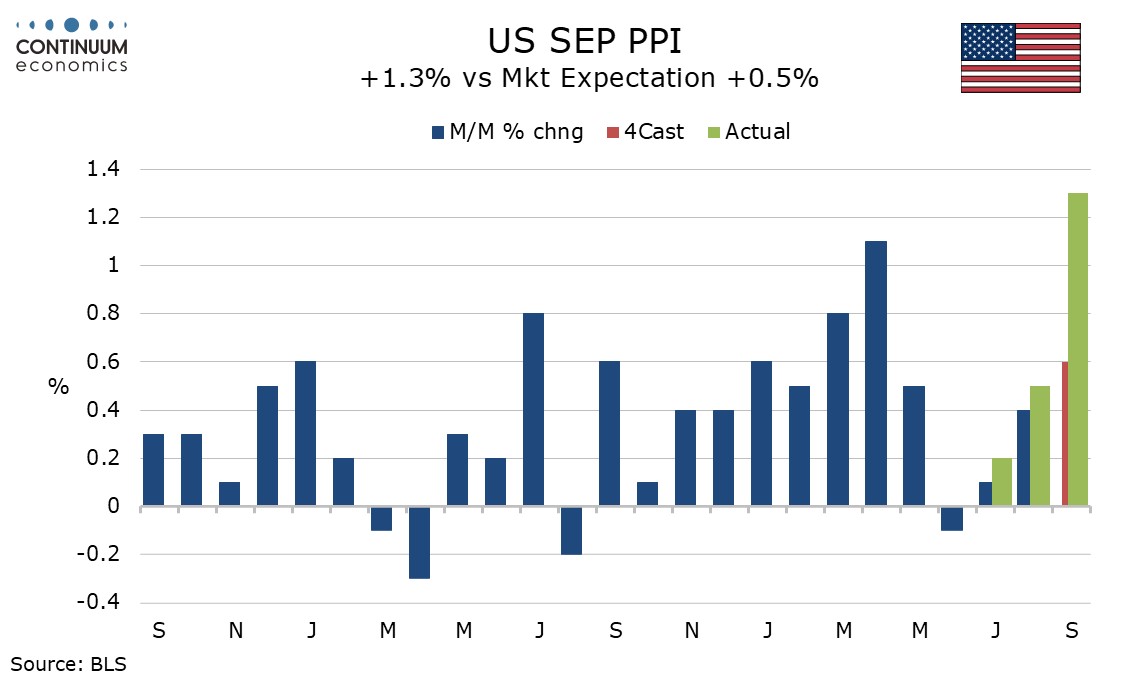
Goods less food and energy were in line with recent trend at 0.3% but services at 0.8% were the strongest since January. The volatile trade component was firm at 1.4%, while transport and warehousing, sensitive to Middle East developments surged by 3.4%. Other services rise by 0.3%, which like core goods are in line with trend.
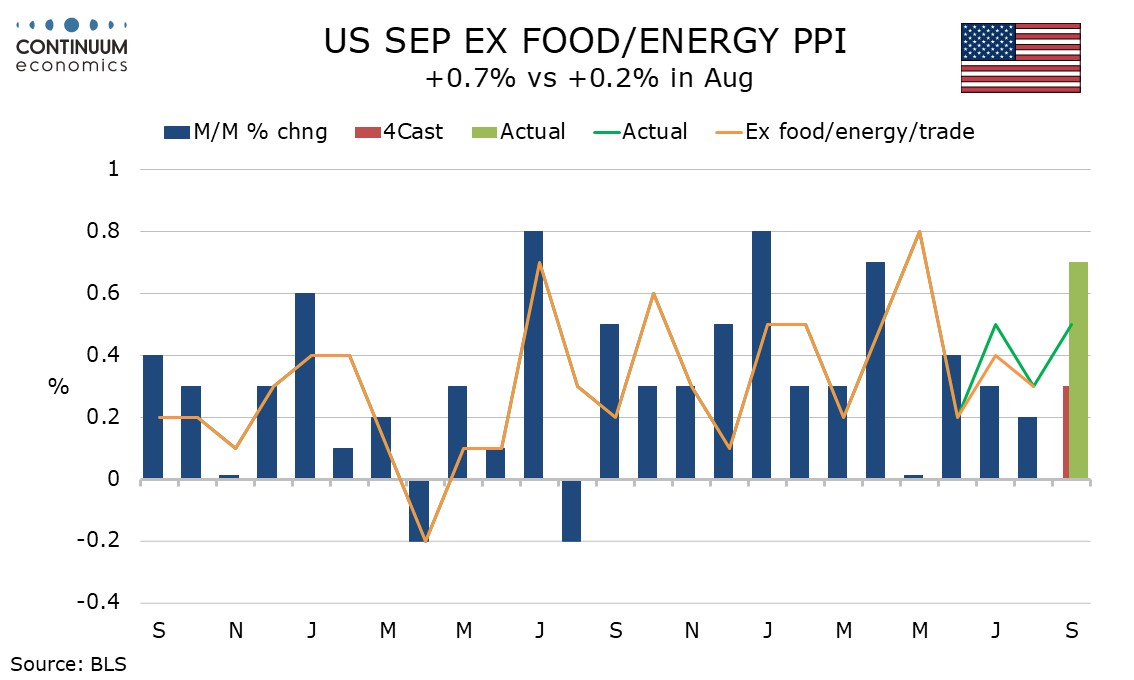
Yr/yr PPI at 6.3% from 5.6% is the strongest since December 2022. Ex food and energy and ex food, energy and trade both increased to 5.0% yr/yr from 4.8%. The former is the strongest since January 2023 but the latter has simply returned to where it was in May and June.
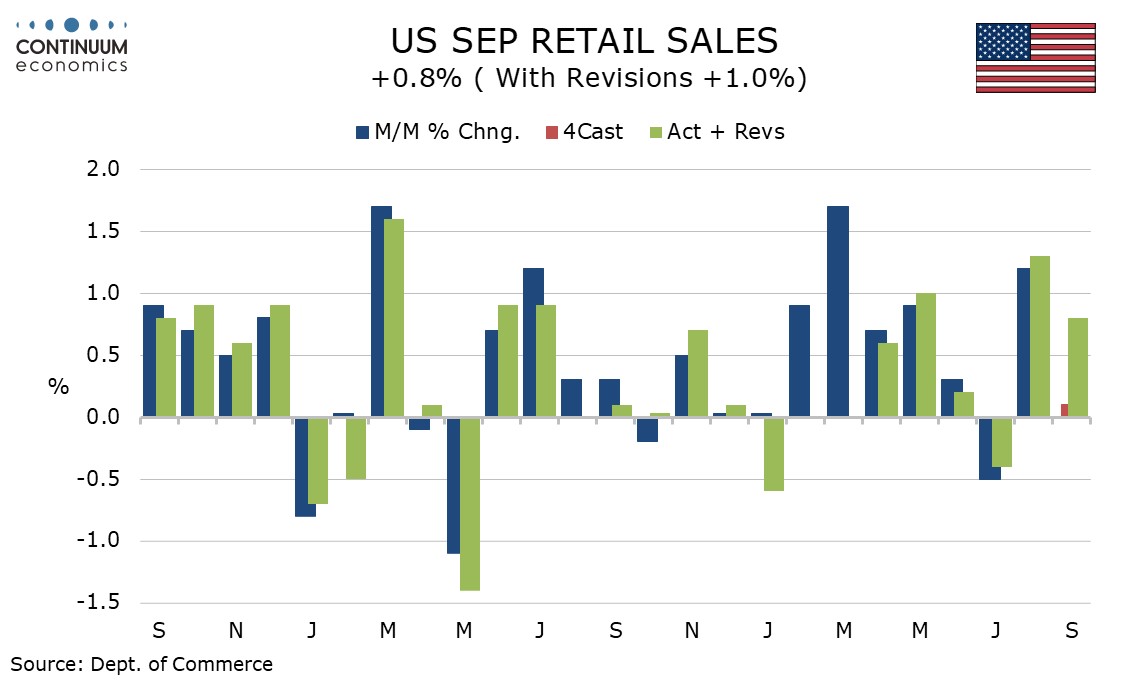
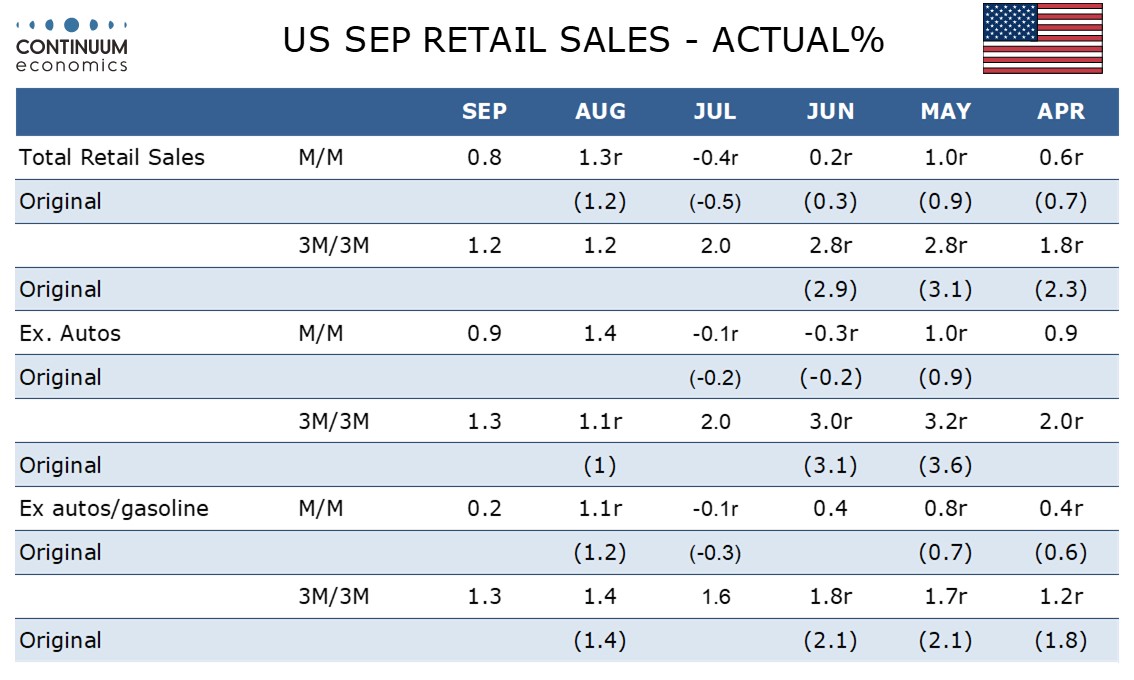
The retail sales rise is quite subdued at 0.2% ex autos and gasoline and even slower at 0.1% in the control group that contributes to GDP, though these gains follow strong respective gains of 1.1% and 1.2% in August. Autos saw a marginal 0.2% increase while a 6.4% gain in gasoline sales was clearly price-induced. Elsewhere in the breakdown eating and drinking paces saw a strong 1.1% rise and that will be counted as services in the PCE and GDP detail, meaning subdued month for retail.
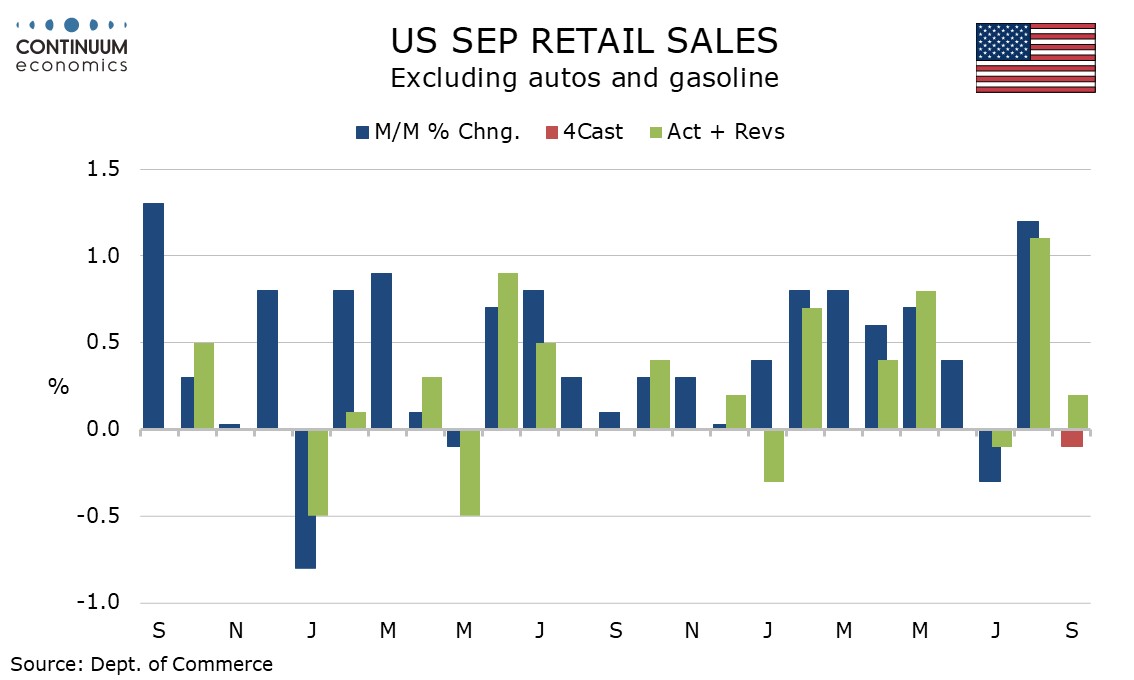
3 month/3 month retail sales gains in Q3 are down from Q2 but far from weak. Ex auto and gasoline is at 1.3% (not annualized) versus 1.8% in Q2. Overall sales slowed more, to 1.2% from 2.8% and ex autos to 1.3% from 3.0% but that simply reflects gasoline being up sharply in Q2 but mixed in Q3. Consumers remain impressively resilient to the squeeze on real disposable income coming from gasoline.
Initial claims at 199k from 198k remain low as do continued claims at 1.710m from 1.714m, though now appear to be stabilizing after recent slippage. The labor market remains stable near full employment even if job growth is modest.
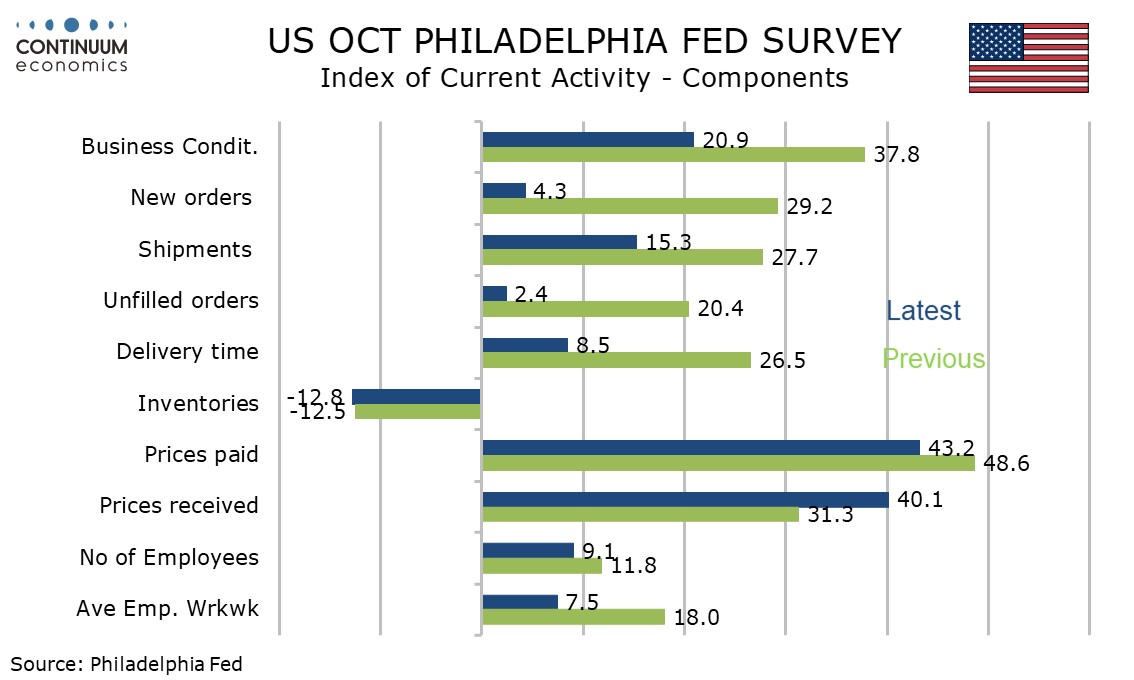
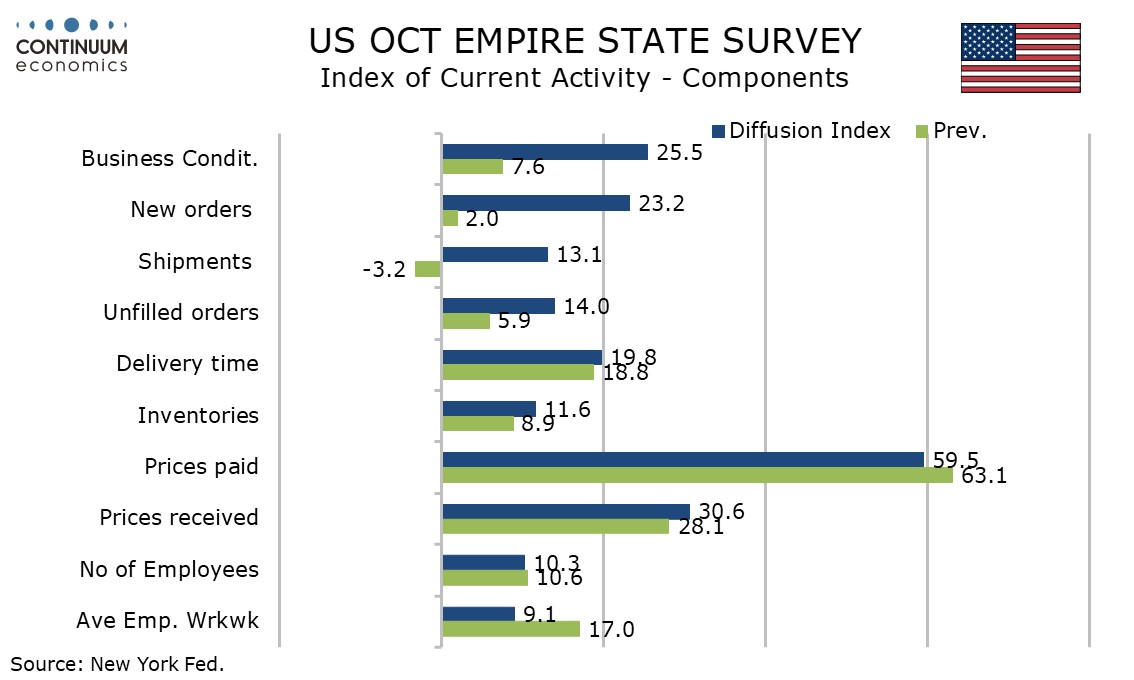
October manufacturing surveys saw the Philly Fed’s slip to 20.9 from 37.8 and the Empire State’s rise to 25.5 from 7.6. Both however are at strong levels and now consistent. Price indices in both surveys were slightly slower for prices paid but stronger for prices received on the current month. Philly Fed price data was softer on a 6-month view but the Empire State’s 6-month price data picked up.