Margin Call - Does Margin Debt Really Predict Market Crashes?
· US margin debt has reached USD1.5tn, the kind of huge round figure milestone that is always going to get a fair amount of attention, especially with the market focused on risk and valuations. Should this number be sounding the alarm? The balanced answer is probably partially, though in a limited sense: it is useful as a measure of market vulnerability, but much less useful as a trigger or market-timing signal.
· Even after detrending, it’s fair to see the data as another measure of market vulnerability (see also here). But it’s more descriptive than prescriptive in terms of triggers, timings and additional forecasting power.
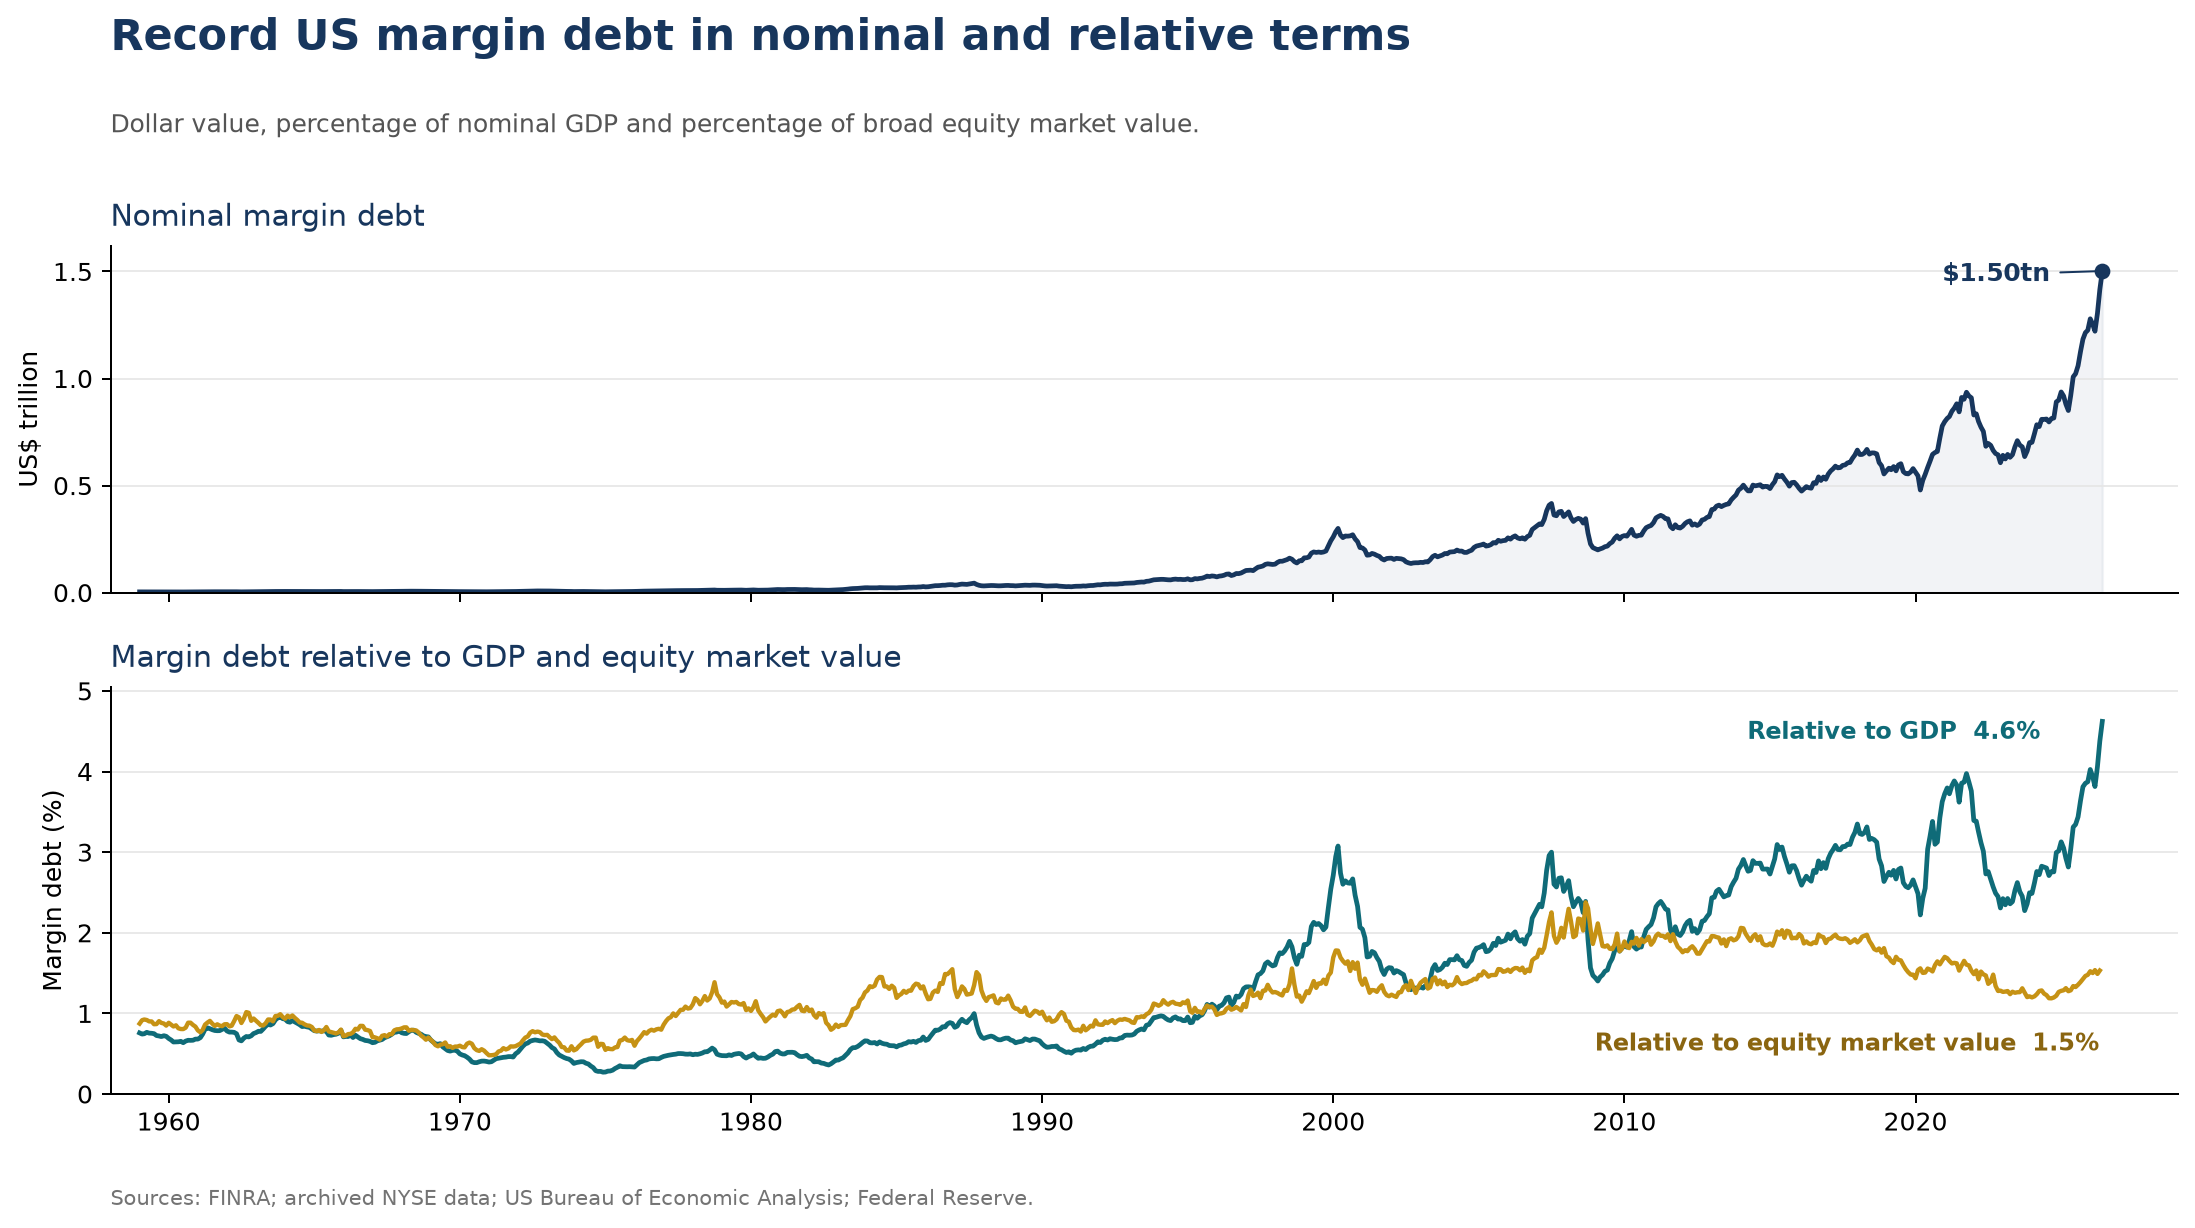
FINRA’s measure of customer debit balances in securities margin accounts reached USD1.5tn in June 2026, the highest nominal reading in the series. Margin deserves attention because it works in both directions: borrowing can reinforce a rising market, then accelerate losses through margin calls and forced selling. Additionally, this indicator can reasonably be viewed as one useful proxy for broader leverage positioning.
Nominal values, of course, continue to compound higher over time, so the relevant measure is not the eye-catching cash value new high – these are inevitable - but calculating some more stationary ratios.
Relative to nominal GDP, the June total was approximately 4.6%. Relative to the value of the broad equity market, it was about 1.5% (using narrower more concentrated indices where margin may be more focused would give a slightly higher ratio).
The latter looks less extreme partly because the denominator (and thus collateral) tends to co-trend with leverage during cycles. Using market cap can therefore tend to understate leverage and sensitivities to abrupt market shifts and margin dynamic changes, even if it’s a useful alternative perspective.
Figure 1: Margin debt outright and vs GDP and broad market cap
Source: FINRA, NYSE, Fed, CE
Even the GDP ratio is not sufficient by itself to get a rounded view. A fuller assessment should arguably ask three things: how large margin debt is relative to the economy, how far it stands above its prevailing trend and how long that excess has persisted.
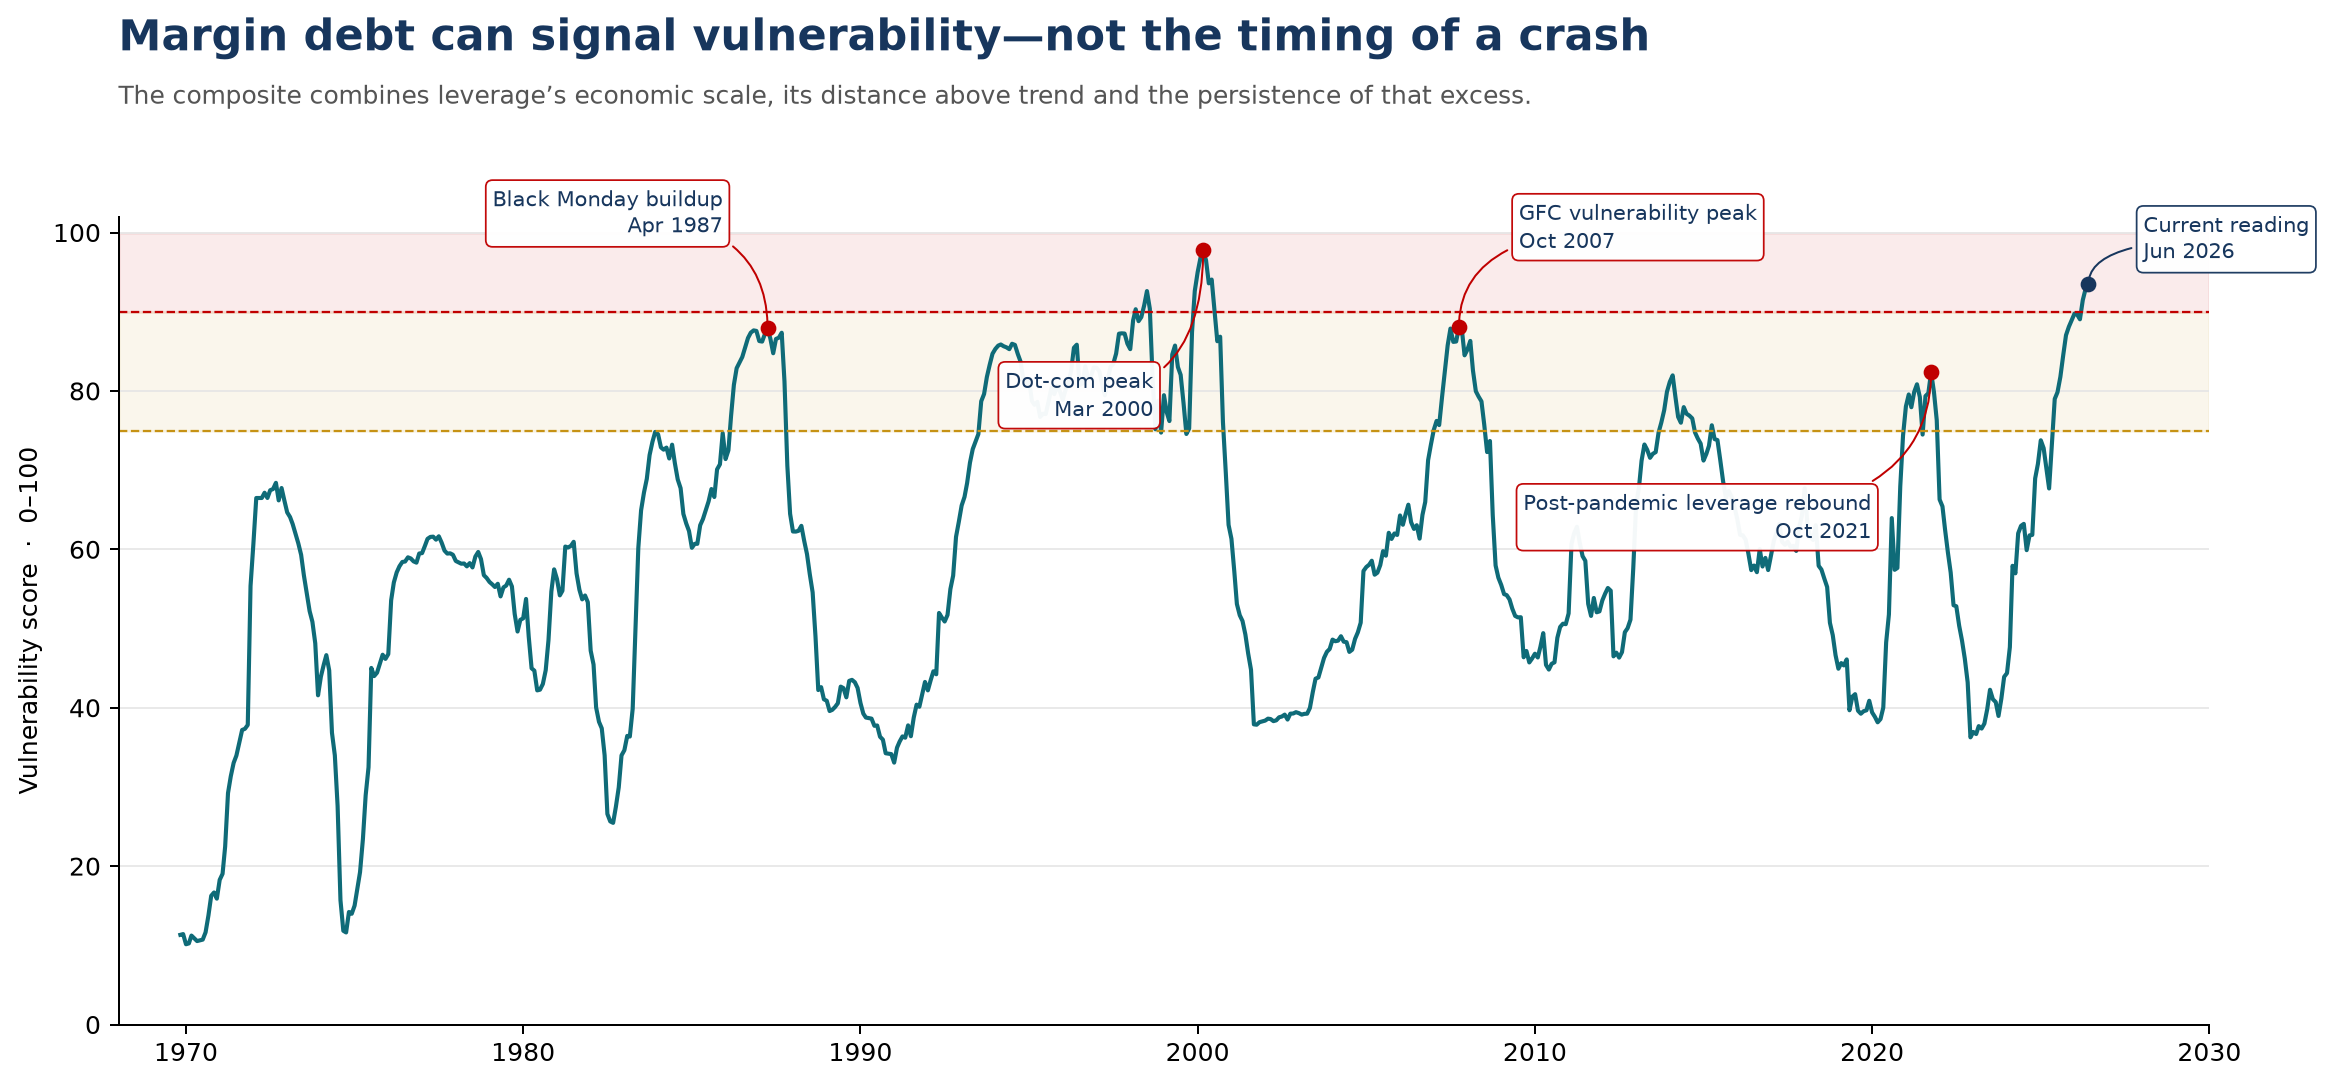
Combining those dimensions produces the illustrative ‘margin vulnerability index’ below. It runs from zero to 100, but it is a percentile-based composite, not a crash probability. That is, reading above 90 means that leverage conditions are unusually stretched by historical standards, not that a crash has a greater-than-90% probability.
Figure 2: ‘Margin vulnerability’ illustrative index, combining level, divergence, persistence
Source: FINRA, NYSE, CE
The resulting history is intuitively corroborative. Vulnerability, as constructed, was high around the 1987 crash, the dot-com peak, and the global financial crisis. The measure also captures the 2021 post-pandemic leverage rebound: margin debt was not as far above its immediate trend as in 2000, but it was large and had remained elevated. There were also false alarms. The index rose above 80 in early 2014 for example when the market at worse only stalled.
Looking at current readings, June 2026 is in the top decile (10%). Margin debt is large relative to the economy, unusually far above trend and has accumulated above that trend over the preceding year.
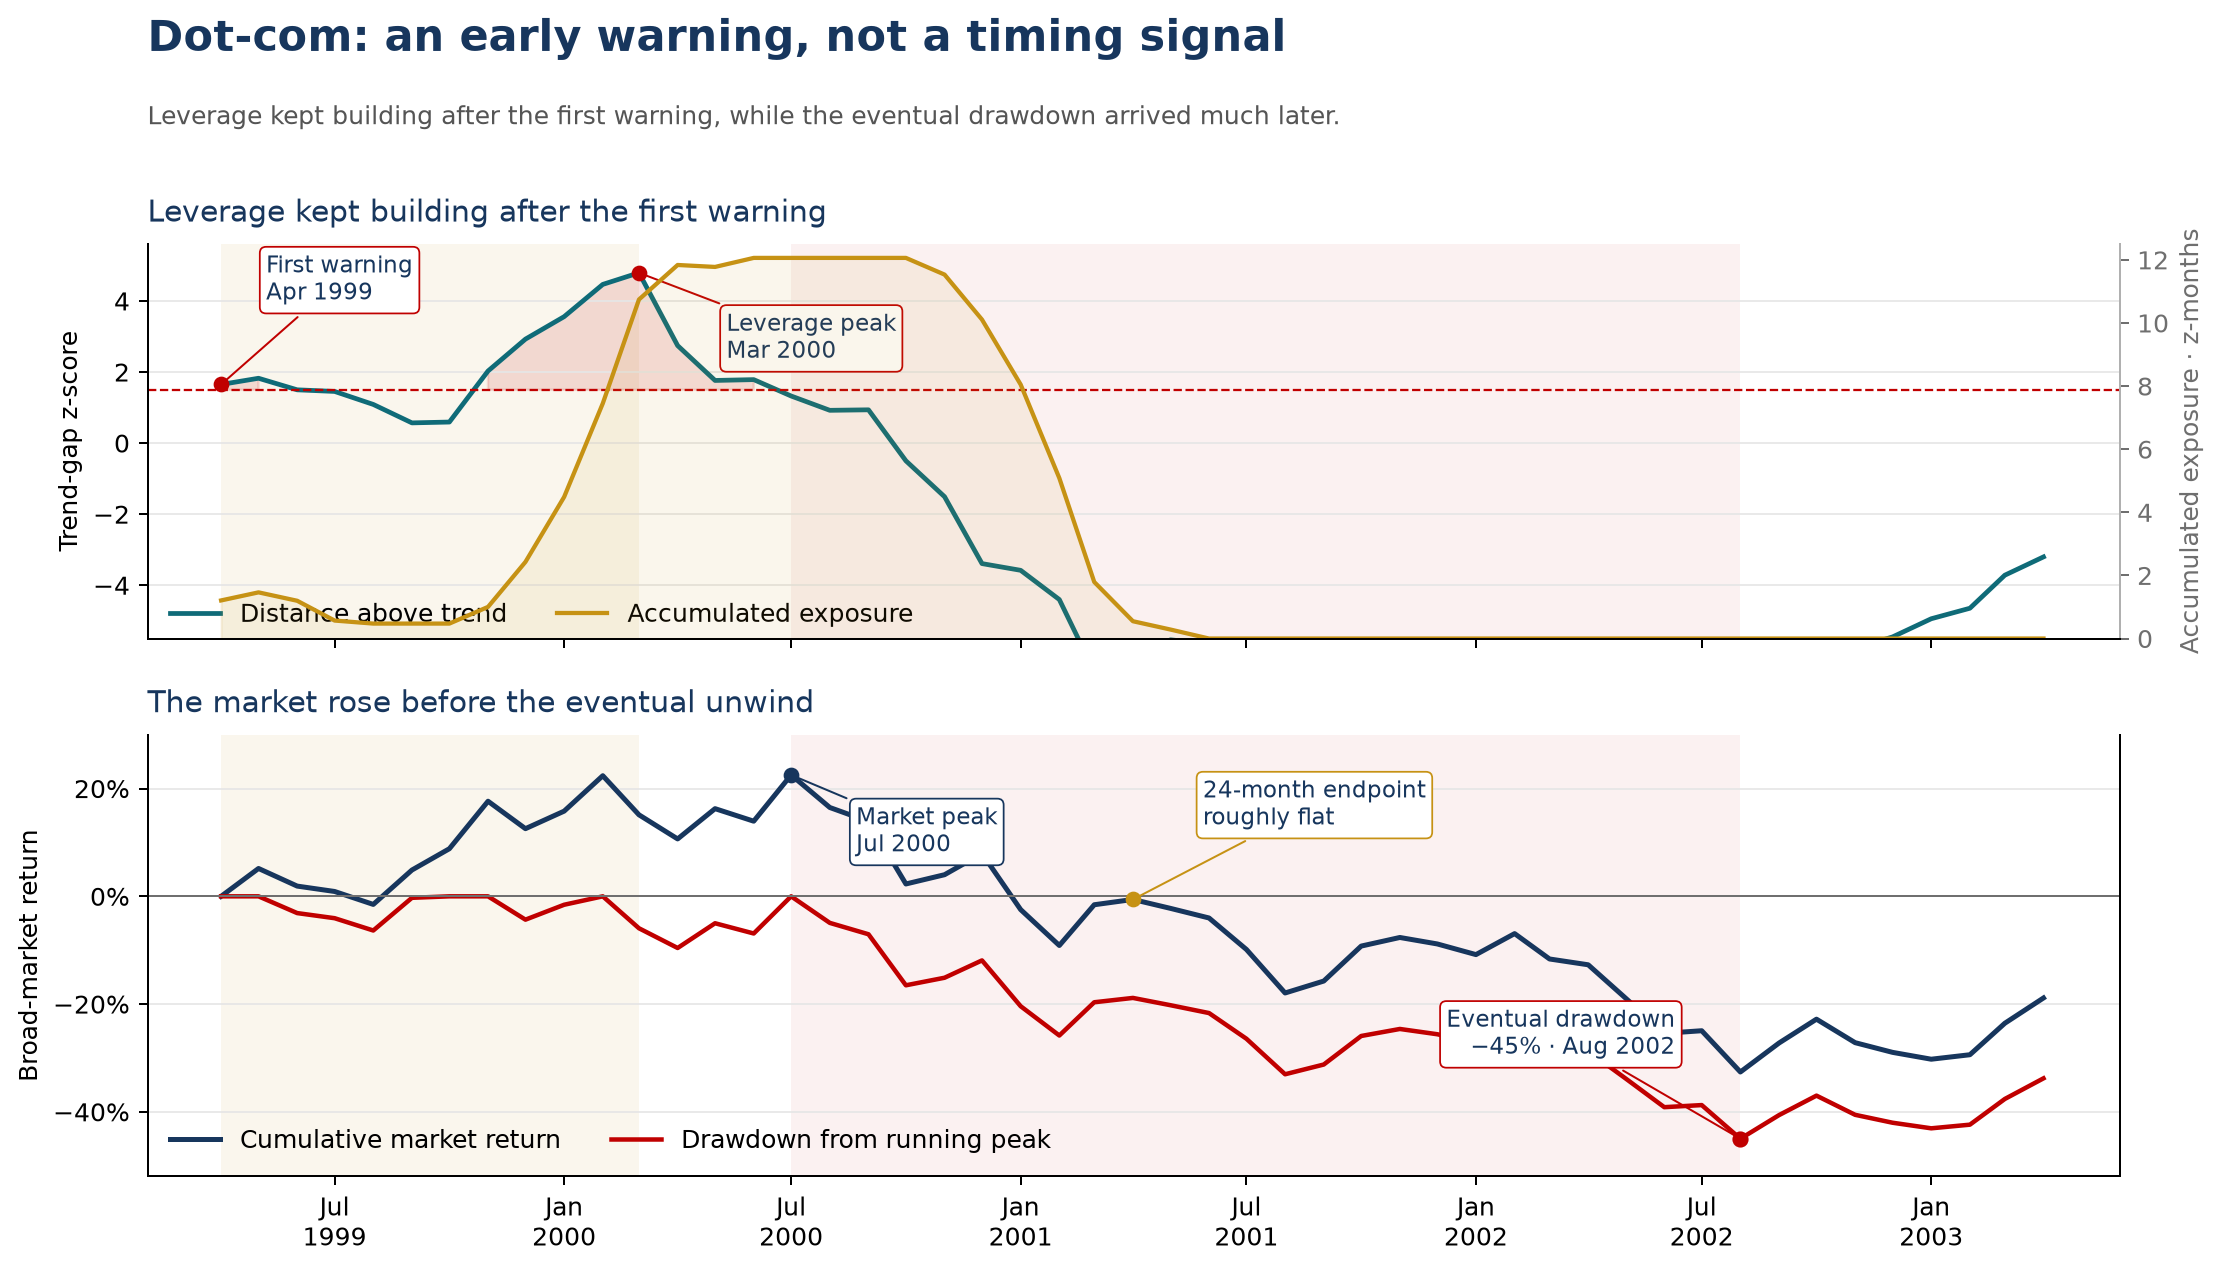
It is also still building. Historically, leverage has sometimes become more dangerous after an extreme expansion begins to roll over. Late July has brought renewed weakness in the Nasdaq, so some focused leverage may already have been trimmed since the June reading. But even the S&P remains only just off the highs so there is no evidence yet of momentum or leverage turn.
Indeed, recent market behaviour illustrates why the path is not mechanical. Some former market leaders have corrected sharply, yet rotation has kept the broad index relatively resilient. That does not mean leverage is harmless or that “this time is different”. It means the data provide context rather than a trading signal.
Figure 3: Margin debt can point to build ups, but less so timing, especially while still rising
Source: FINRA, NYSE, CE
Testing reinforces that distinction. Across the full history, margin debt did not seem to reliably improve forecasts of major drawdowns beyond simpler information such as market momentum and valuation. Persistent leverage appeared somewhat more informative after 1997, when margin debt became economically larger, but too few independent crashes exist to treat that result as meaningful or dependable.
In short, the data descriptively reinforce what the market already suspects: considerable combustible leverage has accumulated, and a shock could be amplified. Margin debt does not identify the shock or tell in itself exactly if and when it will arrive.