Taylor Rules for Uncertain Times
* The Fed’s rate puzzle has three awkward-shaped pieces: which inflation measure to trust, how much slack remains, and where r* now sits.
* Taylor rules may be deeply unfashionable, but they force those hidden assumptions into the open.
* Change only the inflation measure and the same rule can make policy look broadly normal, moderately loose, or materially accommodative.
* The policy rate target building blocks interdepend: a productivity upswing could cool inflation, raise the neutral rate, or do both, over different time frames
* Related, competing readings of the demand–supply imbalance also shapes how much persistence policymakers should tolerate.
Policy rules have come in and out of fashion. Under Chair Warsh, Taylor rules and their like are about as fashionable as forward guidance.
Yet, for all the shortcomings of these crude proxies, they remain useful. Their value is not that they identify “the correct” policy rate but that they make thinking disciplined and assumptions explicit. They highlight how much apparently-modest differences in one’s diagnosis of inflation can change the implied nominal rate. They also bring another live conceptual debate into focus: where the neutral real rate, or r*, now sits in an economy that may be entering a productivity upswing, alongside a saving balance shift.
There is rather more agreement on the other side of the equation. Fed officials broadly describe the economy as balanced, or perhaps modestly tight, whether viewed through an output-gap or labour-market lens.
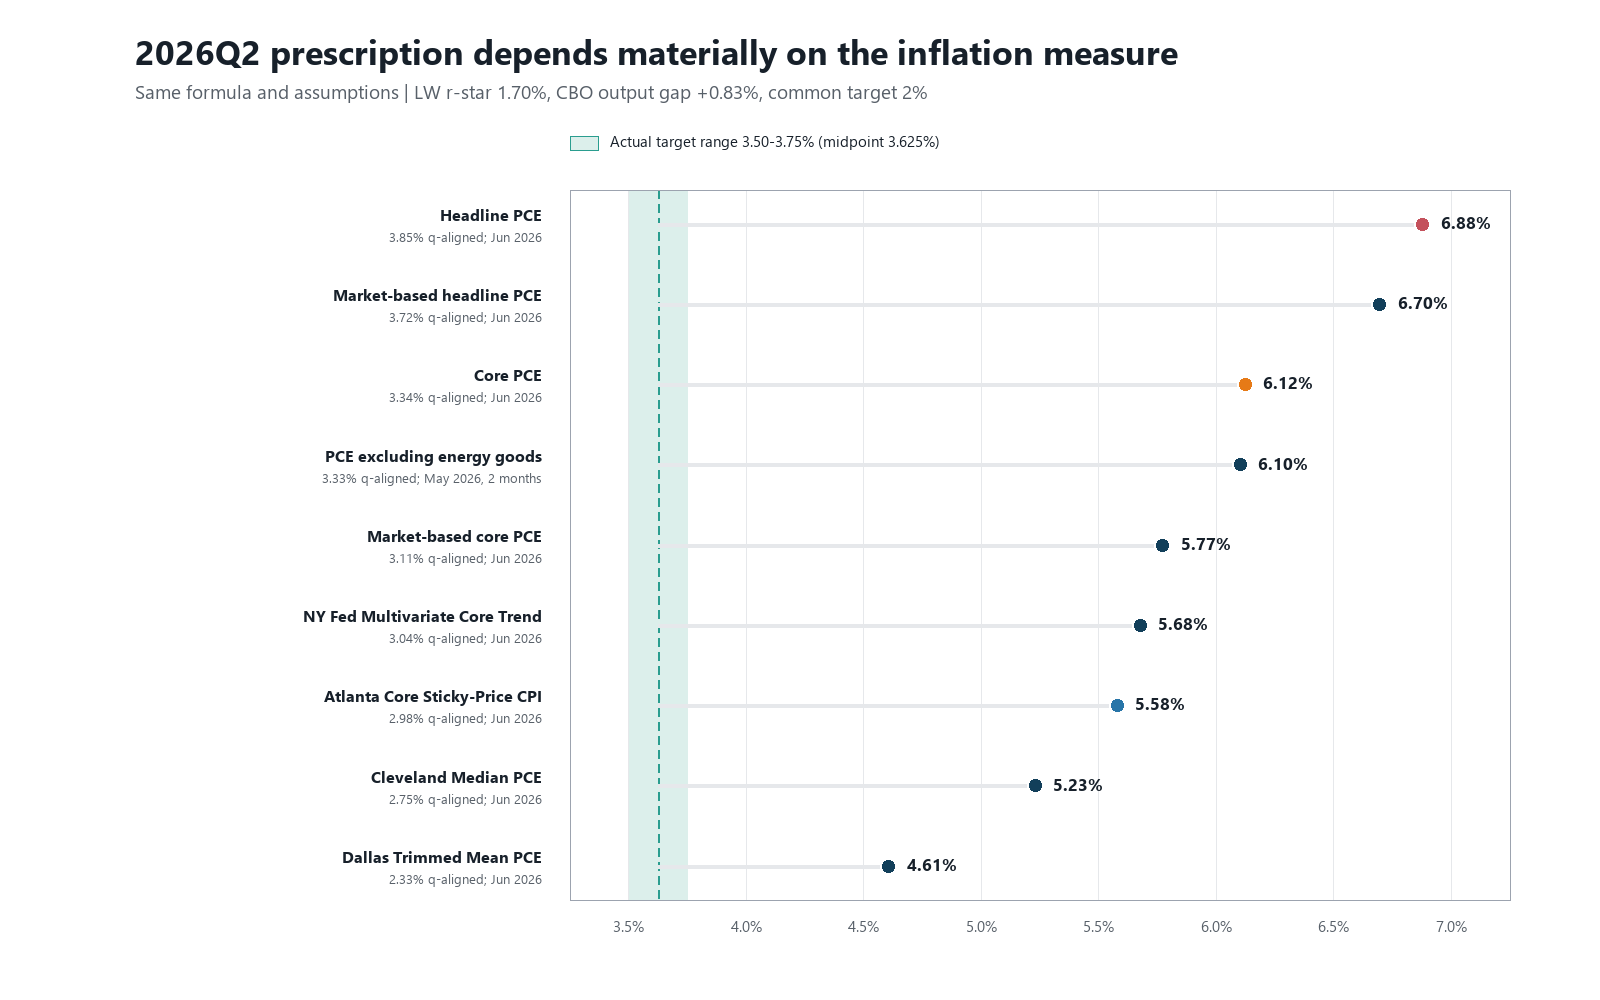
Figure1: Q2 Taylor rules using standard form and fixed assumptions
Source: Various regional Fed, BEA, CBO; CE
With that in mind, this article takes some of the inflation measures examined in the report “Slicing and Dicing US Inflation” (here) and runs them through the same standard-form Taylor rule. It is not a prescription for what the Fed should do but a way of showing how shifting one’s analytic view of inflation determines the outlook. It also pushes home the message that the overall inflation picture as a whole that emerge from the next 2 reports before the Sep meeting will have a big say on the views expressed, especially with some moderation already seen in June versus Q2 as a whole.
A range of Taylor rules, many of them higher…
Turning to the analysis, holding the resource-gap estimate and r* constant, the inflation choice alone produces a notable range of answers.
The main comparison uses the CBO’s Q2 output-gap estimate of +0.8%~ and the Laubach-Williams real r* estimate of 1.7%. Compared to the current Fed policy target of 3.5-3.75% in Q2, the softest average Q2 measure in the exercise (Dallas Fed trimmed-mean PCE) implies a rate of about 4.6%. The highest, headline PCE, implies 6.8%. A span of over 2pp.
The more revealing split is between the measures focusing more selectively on the more relevant range of core versions. Trimmed-mean PCE produces the low result because it deliberately removes the unusually large moves at both ends of the price-change distribution (and could currently be mechanically biased lower). Cleveland Fed median CPI comes in at 5 ¼ %. The Atlanta Fed’s sticky-price CPI gives just over 5 ½ %. The New York Fed’s Multivariate Core Trend estimate implies 5 ½ to 5 ¾.
Then come the measures which project more persistence in the current data: market-based core PCE at 5 ¾ %, published PCE excluding energy goods at just over 6%, and conventional core PCE similar.
The other parts of the puzzle…
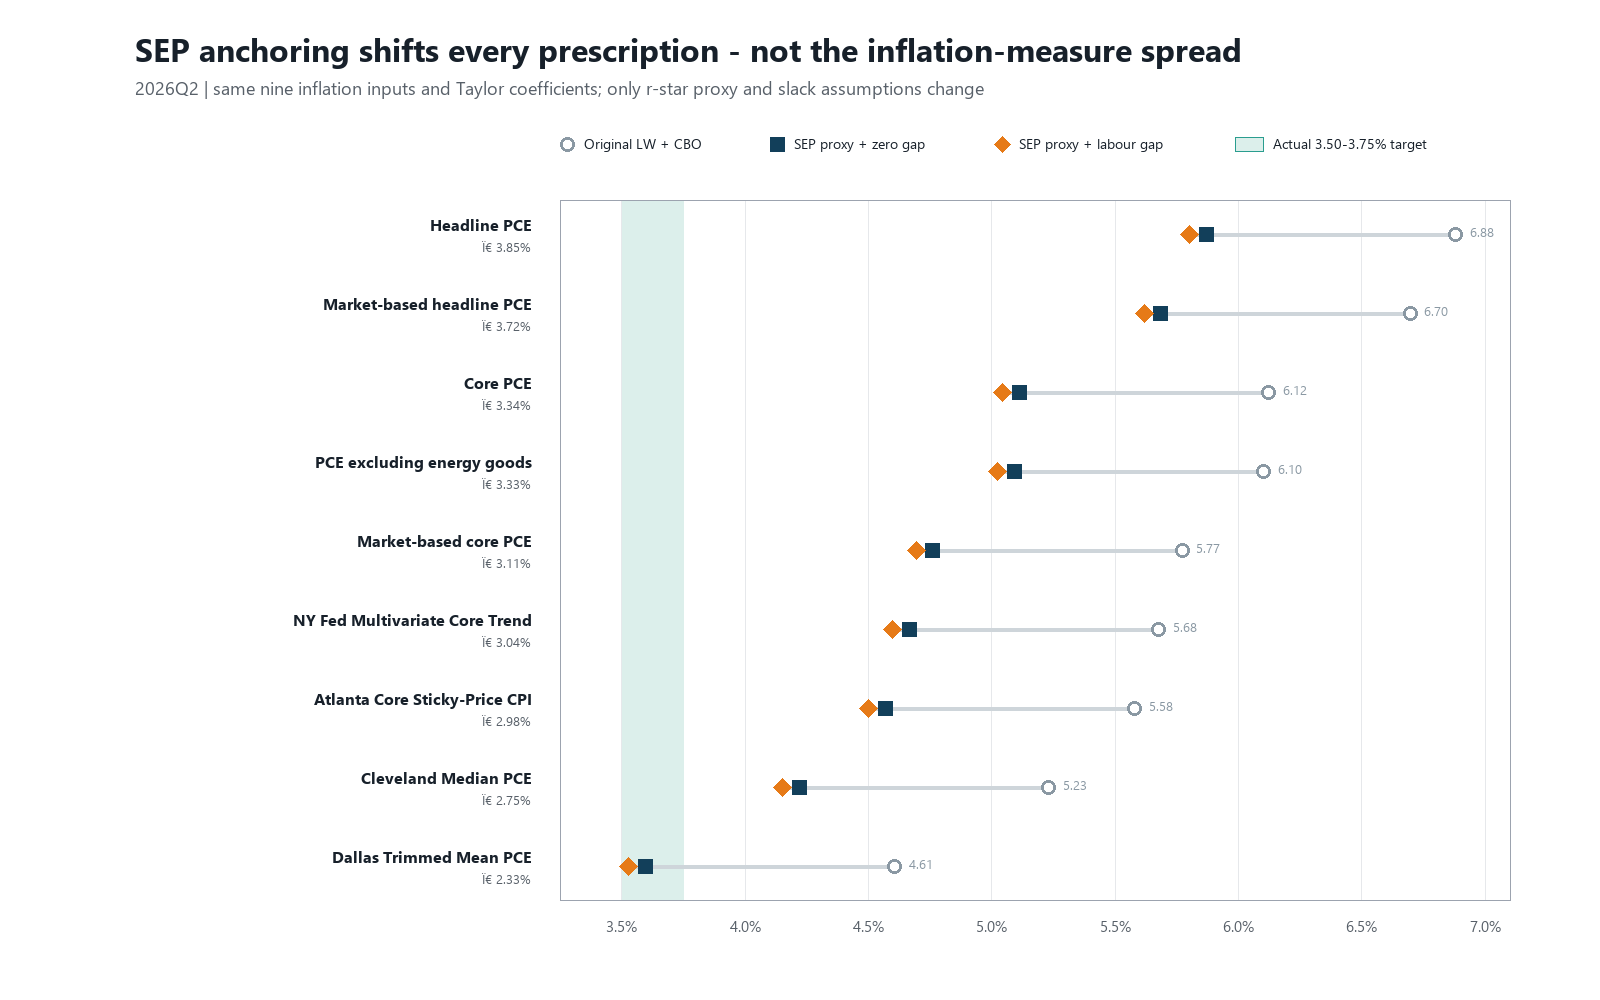
The exercise is not solely about inflation,. Sensitivity checks can help calibrate the range further. On the resource gap side, replacing the CBO output gap with the CBO unemployment-gap measure lowers every prescription by ¼ pp.
Figure 2: Results also sensitive to other core assumptions on r* and slack
Source: Various regional Fed, BEA, CBO; CE
A more qualitative, deliberately simpler case takes the Fed’s frequent description of the economy as “broadly in balance” literally and sets the resource gap to zero. That lowers the standard Taylor prescription by another 40bp relative to the main baseline. Not to be taken too much at face value, but again illustrating how skew can come from reasonably modest supply-demand viewpoint shifts.
Second, for r*, the main Laubach-Williams input of 1.7% is only one estimate and one of the higher ones. The March SEP’s imply a central view of 1.1% real r*. That alone lowers every prescription by about 60bp (although that estimate does seem rather dated, especially from those wanting to push a higher productivity viewpoint).
A recent St. Louis Fed review placed the geometric mean of a variety of estimates at 1.4%, while the individual estimates ranged from below 1% to above 3% (the latter is a somewhat less reliable market-based result, to be largely set aside). This again is not just an academic point since it speaks very directly to the broader debate over whether structural technology shocks, especially those that drive high investment, shift r* more than productivity, less, or do so asynchronously with various time shifts.
Put the two more dovish assumptions together (zero resource gap and the SEP-implied 1.1% r*) and the full Taylor range shifts down 1pp. The result is still a wide range, but it makes clear why someone who takes an opinionated view of slack, r*, productivity and inflation, and with it a high tolerance for "transitional" high inflation for longer than normal, can reach a much less hawkish conclusion without disputing the data.
A framework, not a directive…
A standard Taylor rule produces a reference point, or range of points. It does not tell the Fed to close the whole gap at the next meeting - or at all. More modern rule variants add inertia precisely because central banks tend to move in sequences and amid uncertainty rather than jump mechanically to a calculated destination.
That is also compatible with a policy path that stays on hold and even eventually eases, when forward-looking. Such a path embeds a hard forecast: growth slows, labour-market pressure softens and inflation gradually converges. Taylor rules provide the real time benchmark for judging the ‘balance of risks’ around forecast-based policy-setting with uncertainty in real time and how to weight the cost-benefit of those decision risks as more data comes in.
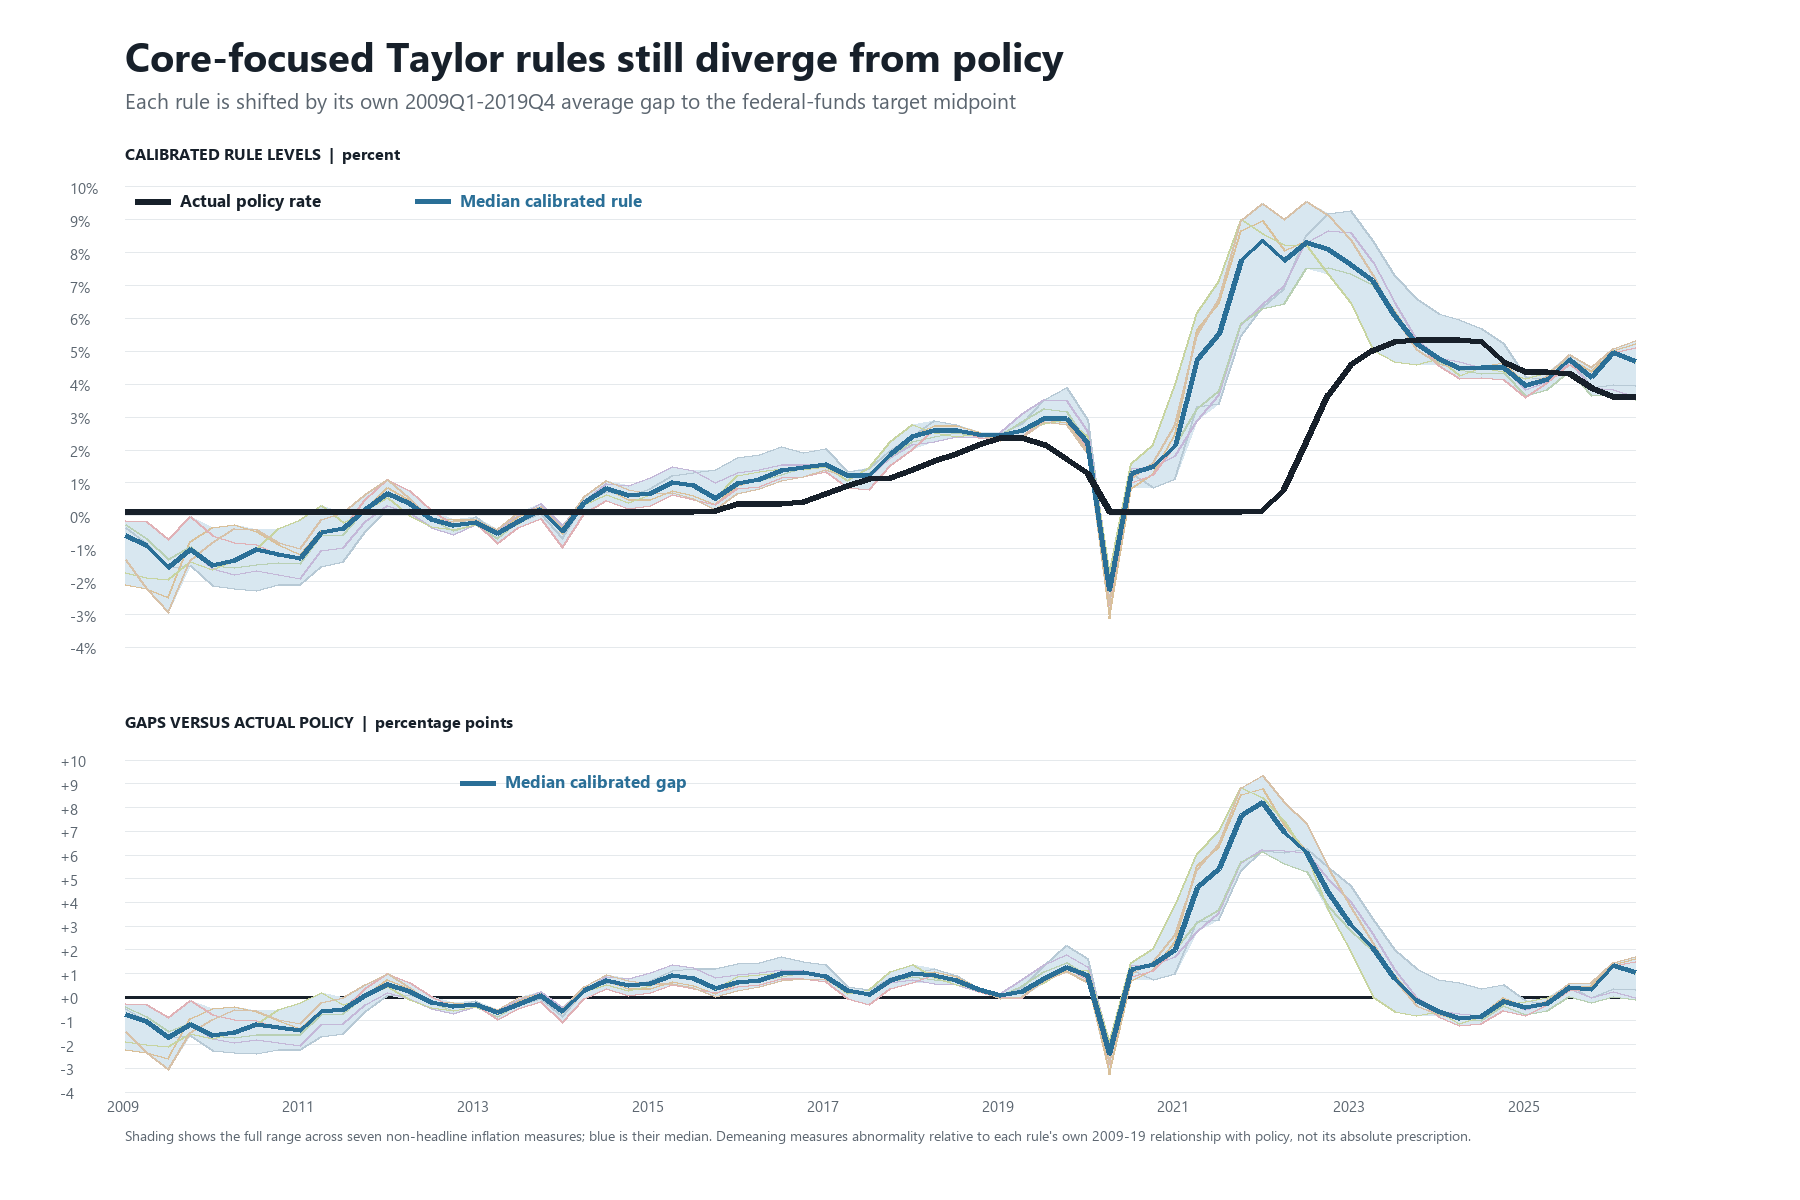
Figure3: Q2 normalised results (removing average overshoot) on baseline assumption
Source: Various regional Fed, BEA, CBO; CE
There is also a useful historical check before being too literal in read-offs. This doesn’t go to the lengths of building a regression reaction function, given these can be unstable through a sequence of shocks and policy errors and would likely be underspecified without a lot more elaborate and post fact fitting. Instead, it’s just worth noting that Taylor rules have often, typically, sat above the actual funds rate since the global financial crisis
The simpler check is just to recast the comparison as whether the current Taylor rules are "unusually far" above the prevailing. On the baseline, historically calibrated comparison, the Dallas trimmed-mean Q2 result is almost exactly in line with its normal historical shortfall. By contrast, the multivariate, conventional-core and ex-energy-goods diagnoses remain notably further above the actual rate than their own post-crisis norms.
Calibration and robustness checks, not policy rules…
The Fed should not hand policy to a spreadsheet of course. Inflation data are noisy, energy can leak into core and back out, relative-price changes matter alongside general inflation, and no single core measure stably defines the truth.
There is also a judgement call that no static rule can settle. A policymaker who sees longer-run expectations as anchored, the economy as broadly balanced and much of the current overshoot as relative-price change may be willing to tolerate a prolonged path to 2%. Another may see persistence above target as precisely the reason patience has become risky. The rules just make their different implications more visible.
The opposite error is to treat the choice of measure as a technical footnote. As previously discussed, it is central to the current debate. A world in which inflation is genuinely settling 2½%+ is different from one seeing relative price shifts on the way to renewed disinflationary influences. June measures were softer than Q2 as a whole so it will be important to see how the next few go on from this.
Near-term, more pragmatically, while Fed Chair Warsh has downplayed the importance of incoming data points (implicitly rejecting the data-dependent cliché, along with just about any other policy-outlook framing in fact), it is still fair to say that the next couple of inflation prints, viewed across their full spectrum, will play an important role in shaping how Fed members judge the balance of risks: whether it is prudent to wait and see if the rule prescriptions can converge towards the current target rate further out (and, in time, towards lower rates); or whether the greater risk is that the current setting is too accommodative relative to current rule references, and risks remaining so for too long.