FX Daily Strategy: Asia, May 20th
Geopolitics Continue to Drive DXY
JPY Risk Further Losses
UK CPI Sedate For Now
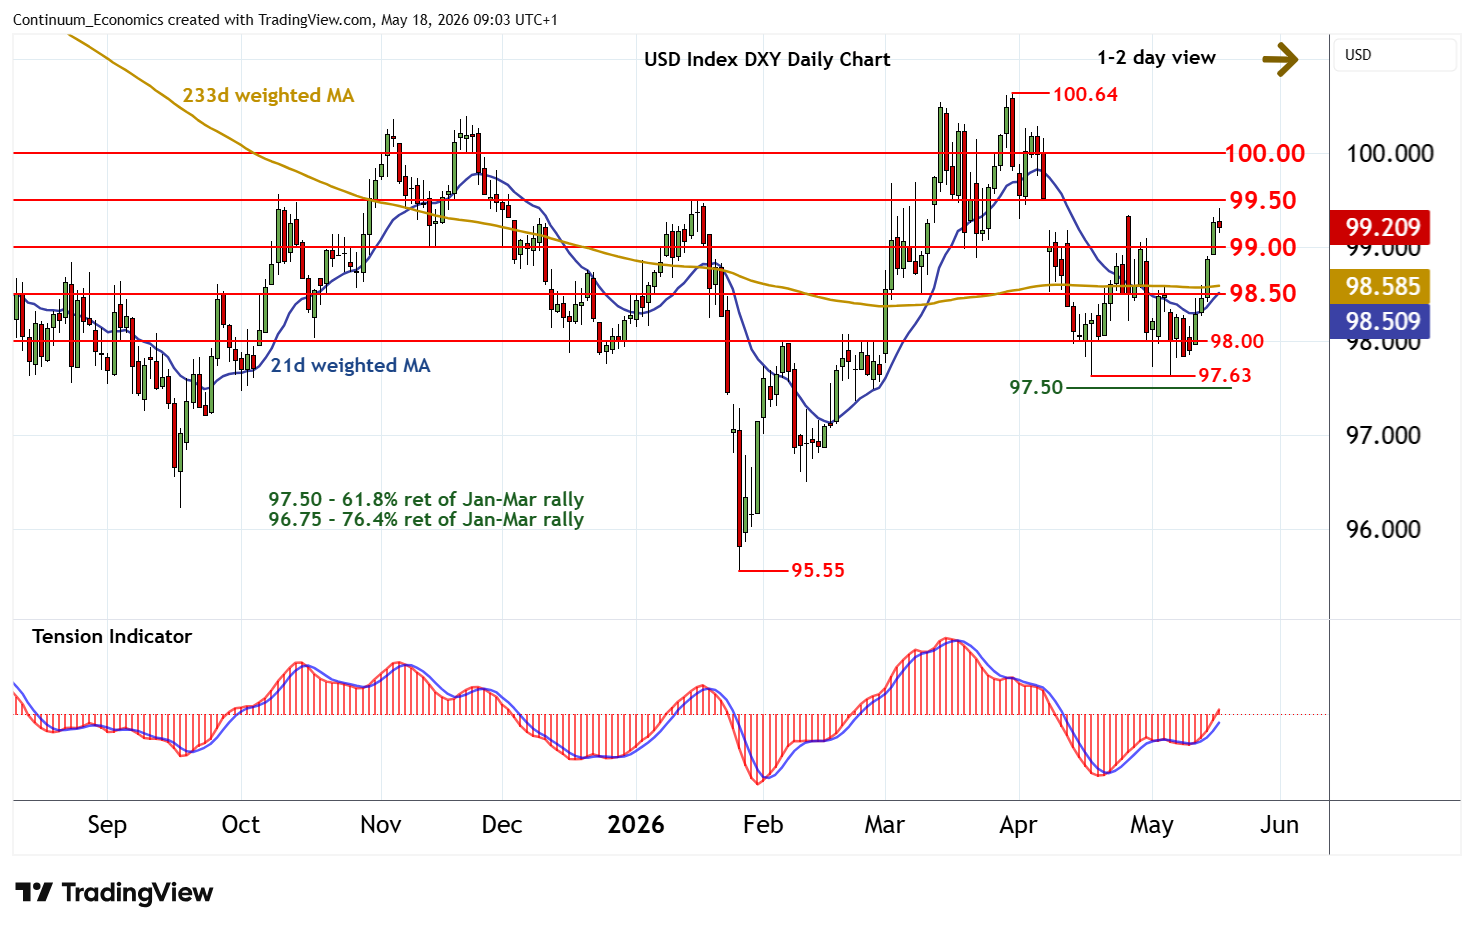
The broader FX market continues to be dominated by geopolitical flows. Despite Trump's chatting up potential deal, market is ignoring his "cry for the wolf". It is clear that Iran has been calling him bluff and does not seem to be interested in negotiations. The repetitive drone strikes and lack of progress within Strait of Hormuz suggest these sticky topics are unlikely to be resolved soon. Such could provide a steady bid for the USD.
On the chart, anticipated gains have meeting selling interest around 99.40, as overbought intraday studies turn down, unwinding negative divergence, with focus turning to congestion support at 99.00. A test beneath here cannot be ruled out. But rising daily readings and mixed weekly charts should limit scope in renewed buying interest above further congestion around 98.50. Following cautious/corrective trade, fresh gains are looked for. However, a close above resistance at 99.50 is needed to improve sentiment and extend mid-April gains towards strong resistance at congestion around 100.00.
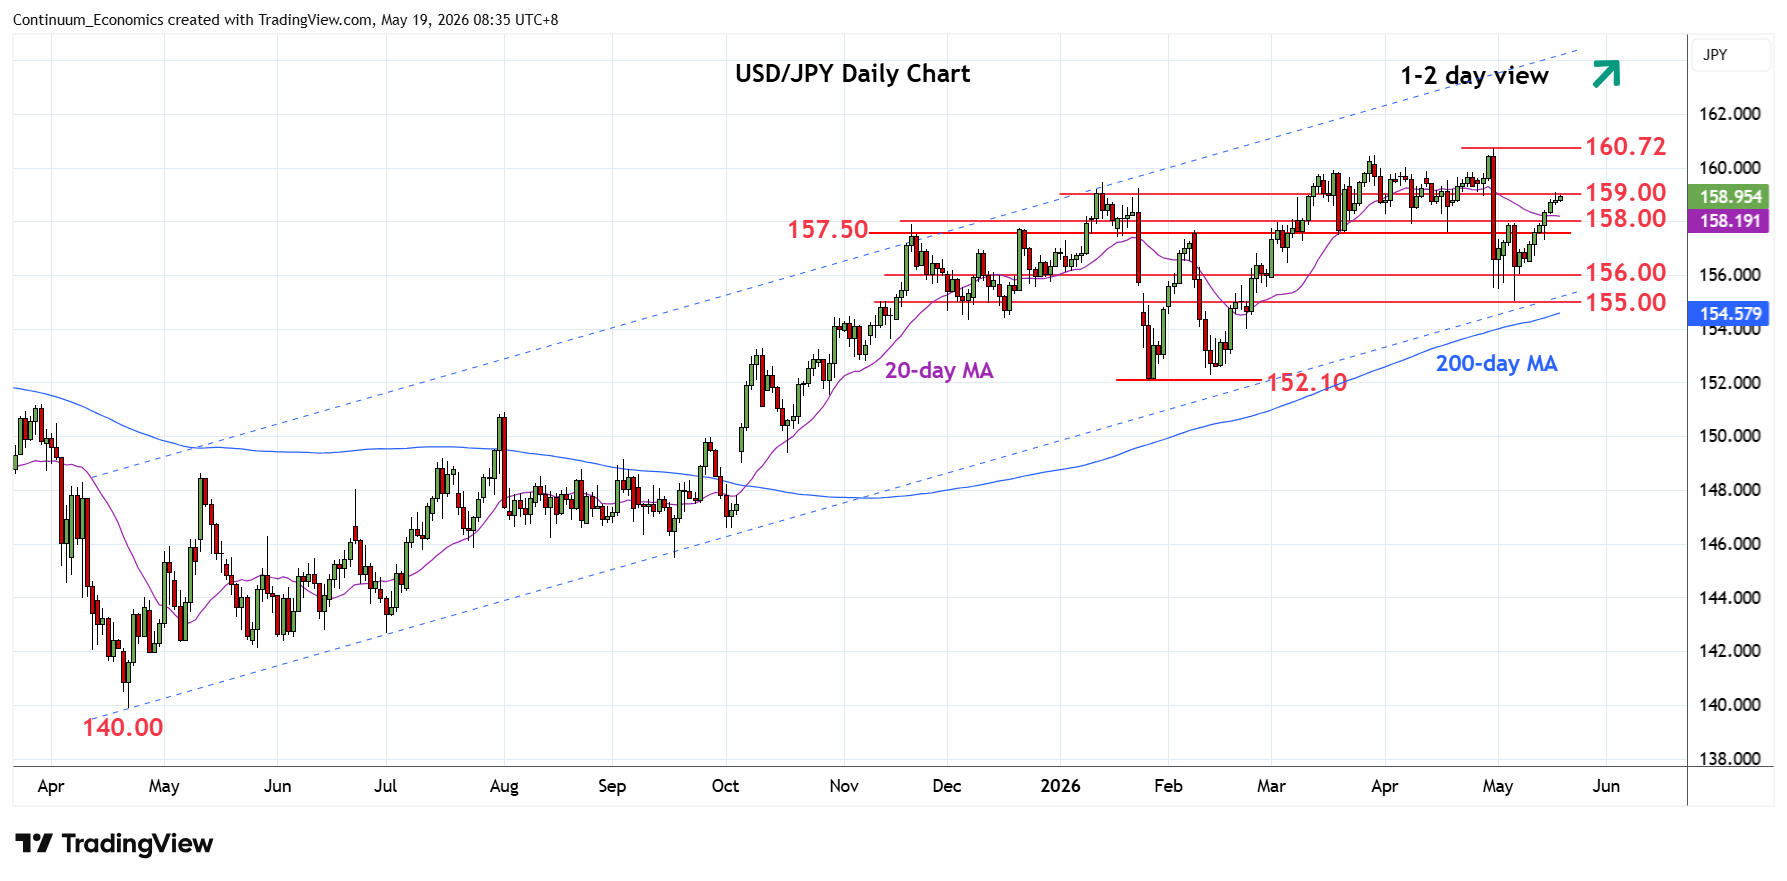
With JGB yields jumping fast on fiscal worries, USD/JPY is fast approaching the 160 figure. The latest deterioration of market confidence begun with the announcement of new debt issuance from the Japanese government to fund energy stimulus. Bearing the weight of oil disruption, energy stimulus has already been extended to June and could require further extension if the geopolitical tension persists. The long end JGB yields have already risen more than 10% since last week and not shown signs of exhuation. It may trigger an intervention from the BoJ soon.
On the chart, consolidating test of the 159.00 level but pressure remains on the upside and suggest scope for break to extend gains from the 6 May swing low. Clearance will see room for extension to strong resistance at 159.45 January high then the 160.00 figure where renewed selling pressure can be expected. Meanwhile, support is raised to the 158.00/157.50 congestion area. Would take break here to fade the upside pressure and open up room for pullback to retest support at the 157.00/156.00 congestion area.
Figure: Headline And Core Much Softer?
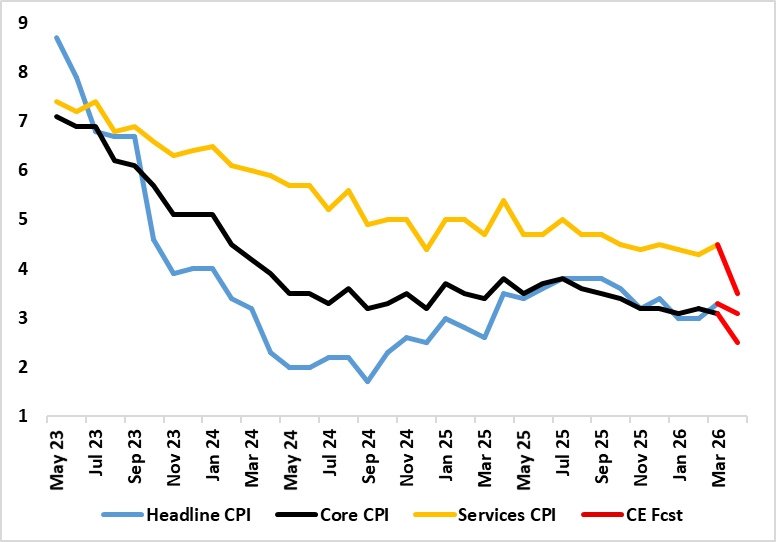
What are energy induced price rises are now very evident, most notably in PPI data as well as the more closely watched CPI figures. Thus after a stable 3.0% (a 10-mth low) February’s headline – matching the consensus, headline CPI jumped to 3.3% in March. Services, however, rose from 4.3% a four-year low (Figure) to 4.5% on the back if what may have been early Easter induced airfare rises, but the core still edged down a notch due to lower non-energy good inflation (Figure). Much softer inflation readings are seen in the April, data both as Easter effects unwind and also those from the array of service and utility prices rise of year before compounded by the OFGEM-induced energy price cap cut in prices. Indeed, we see the headline done to 3.1% despite a circa 6% rise in fuel related energy, this offset by services dropping almost a full ppt, taking the core down to 2.5%. But base effects are not the full story as even adjusted, smoothed m/m data are offering more subdued signs as are company price expectations and actual recent wage pressures.