Slicing and dicing US inflation – why different measures are at the centre of Fed debate
* Wide divergence of US inflation measures becoming increasingly material to policy debate and sets the unusual statistical backdrop to the next CPI release
* Reflects many of the divergent opinions over AI, ‘relative price adjustment’ vs generalised inflation, temporary vs persistent overshoot. Choice of measure becomes a choice of world view
* Most new measures converge on a Fed Logan type view that inflation has recently been stable but in mid to upper 2%
Heading into this week’s much-watched US CPI report, the issue has increasingly become not just what the data print, but which version, and which cut, to track. The choice of which inflation measures to focus on is not just a wonkish statistical question but an increasingly normative one with material policy implications. Indeed, the upcoming taskforce on this issue is as much of an economically opinionated exercise as a technical one, amplified by the current unusual spread of outcomes.
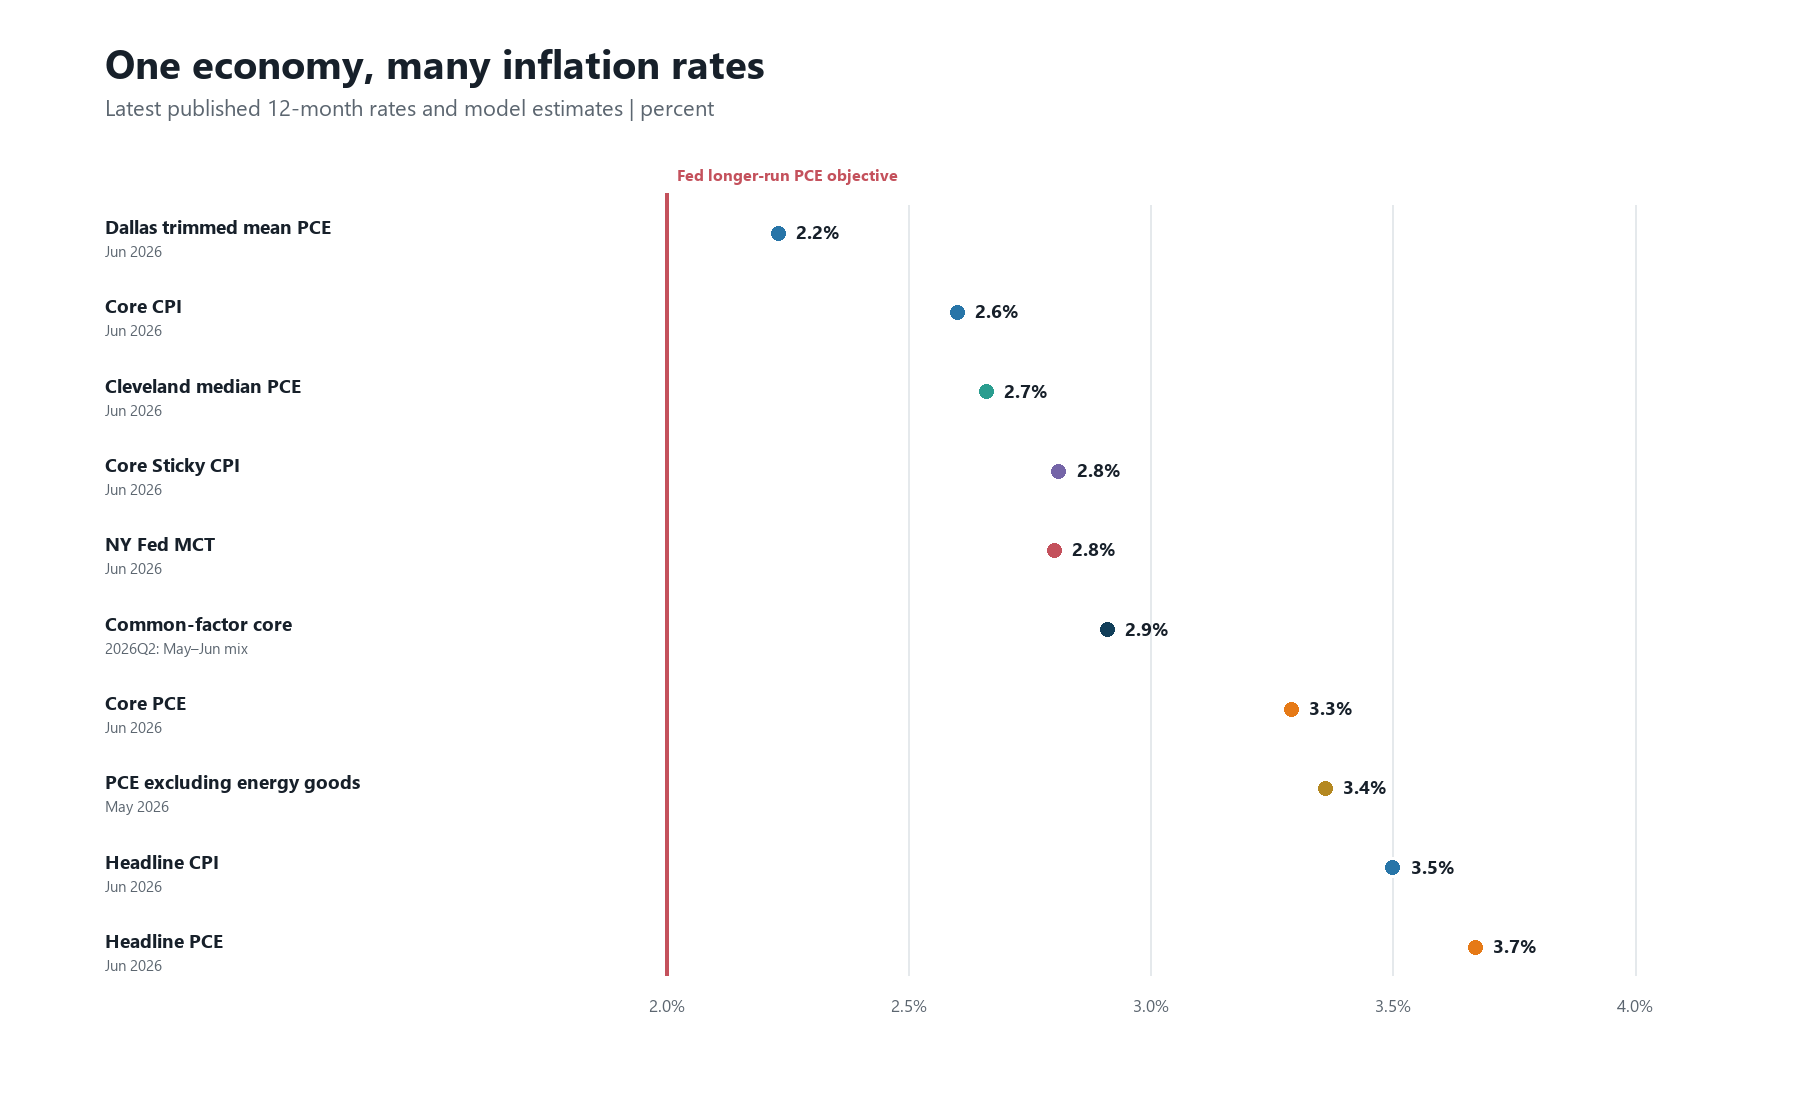
The Fed, of course, is currently mandated to target PCE, but even here the recent picture has been unusual: CPI at 3.5% is running 0.2pp below PCE, while core CPI at 2.6% is well below core PCE at 3.3%. This reversal is unusual, with CPI typically running ¼ to ½ pp above PCE on average over the long run.
Swings in the gap largely reflects different baskets and coverage. CPI gives more weight to shelter; PCE gives more weight to areas such as health care, financial services and information products, and includes some spending made on households’ behalf.
Perhaps most relevantly to the current debate, a recent Fed study highlighted the impact of the recent AI boom. Computer software and accessories represent 1.2% of core PCE but just 0.035% of core CPI. From November 2025 to March, the category added 0.66pp to the four-month annualised core PCE rate, and virtually nothing to CPI. Quality adjustment and category matching make the precise ‘true’ number uncertain with some risks of notable measurement error highlighted, but the larger point remains.
Figure 1: A broad diffusion of inflation measures telling different stories
Source: Various regional Fed and BEA data points; CE
Outside of this prominent current wedge, though, there is a whole range of measures that speak to the more critical question: is current PCE upside just a handful of relative-price-level moves, or does it have enough persistence and spread to suggest a still elevated trend inflation?
Conventional core variants generally lean below standard core. In June, Dallas trimmed mean PCE was 2.2%. Cleveland median PCE was 2.7% and Atlanta core sticky CPI 2.8%. These measures remove tails, select the weighted middle, and focus on infrequently adjusted prices respectively.
Note that, generally, while lower than the overall core highs, they remain elevated outside of the Dallas trimmed. The latter is interesting in that Fed Warsh has been reported to favour this lower figure in the past - though he recently downplayed any such suggestion - but it does come with issues. For one, Dallas Fed itself has acknowledged that its asymmetric trim removes 31% of expenditure weight from the upper tail and 24% from the lower tail. That is calibrated to rebalance historic skew, but can instead mechanically distort the figure lower when that is not the case - that is, when there is inflation pressure and a number of categories rising more sharply.
There are a number of newer, innovative measures aiming to bring a new slant. St. Louis Fed’s recent PCE-excluding-energy-goods version re-analyses variance and finds that food is typically less erratic than many other standard core categories. It instead removes gasoline and other energy goods but keeps energy services and food. The construction retains 97.2% of PCE expenditure coverage while reducing variance. This core measure still comes in at 3.36% as of May. Note the author of this work also pointedly highlight that the Dallas trim version, which ends up capturing only 45% of expenditure, has low correlation to headline and “appears to struggle more than the other aggregates presented here in tracking the underlying trends in inflation”.
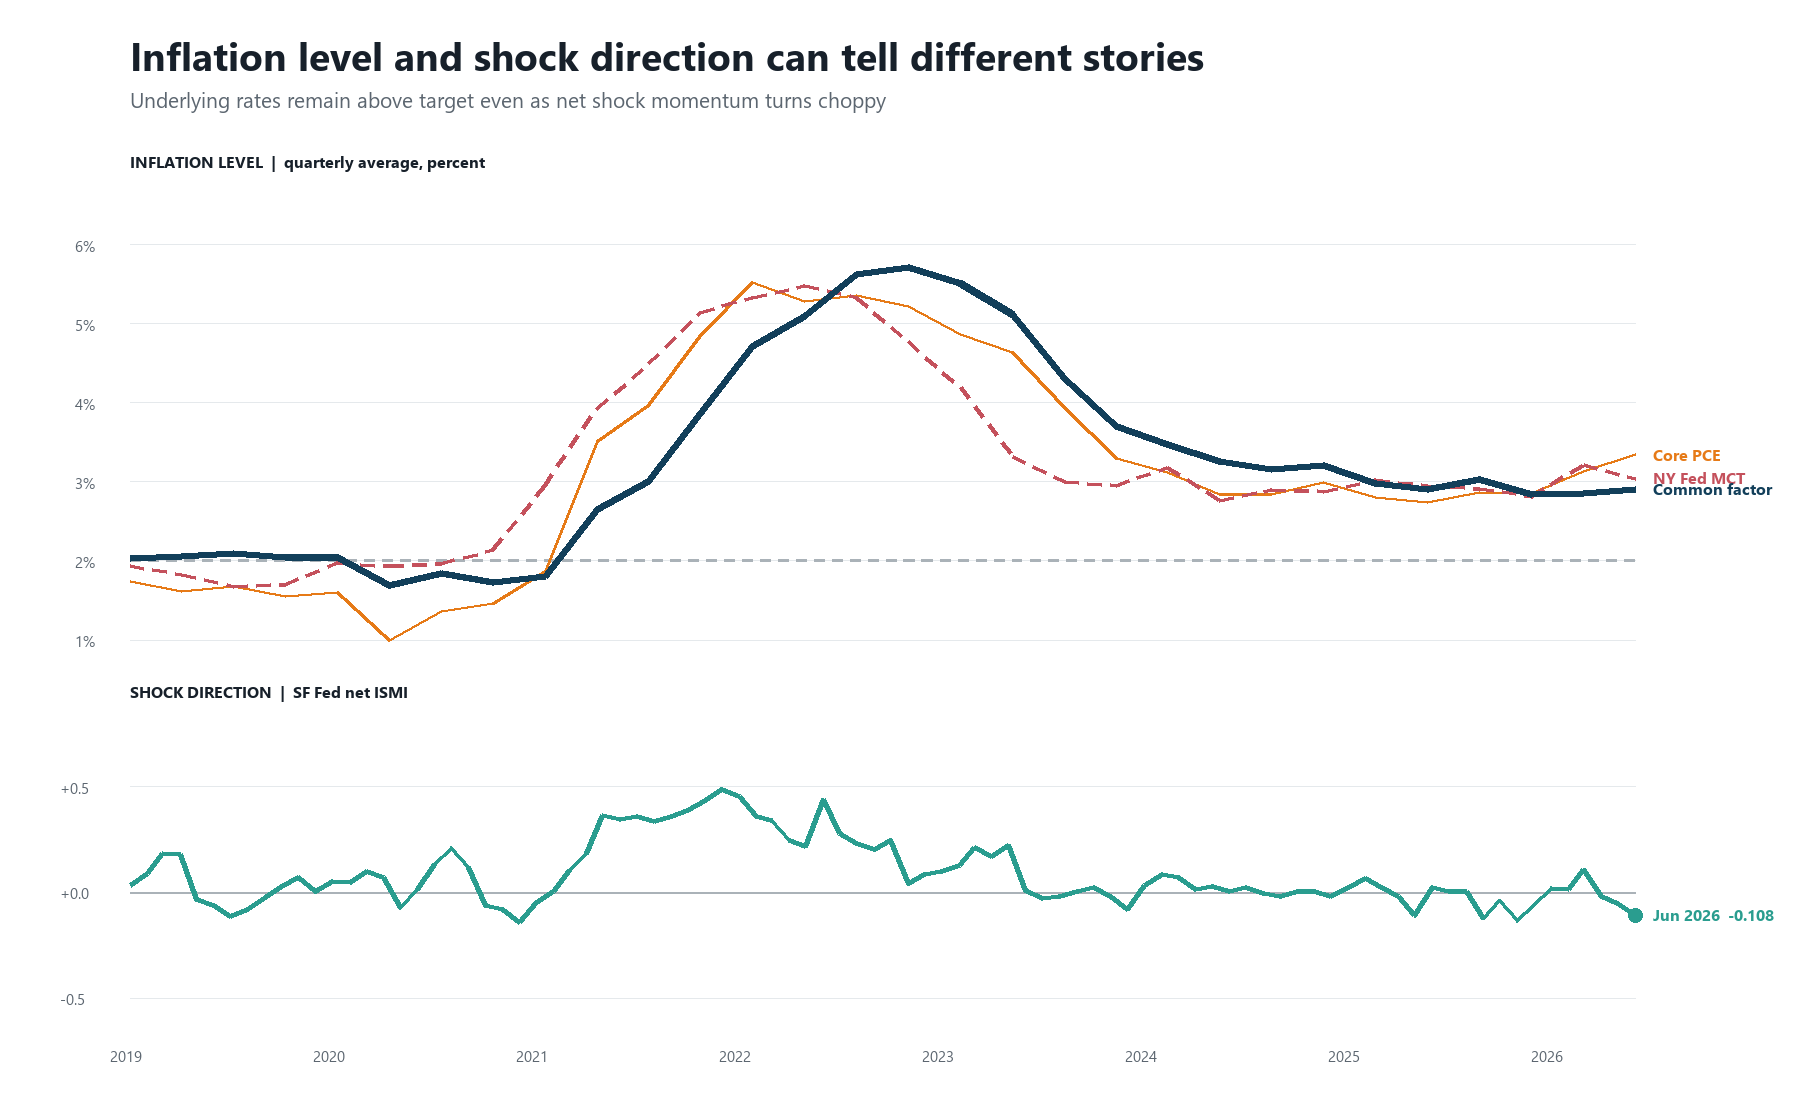
Figure2: A new measure of momentum – recently choppy, not accelerating
Source: SF Fed; Lansing, Kevin J., Adam Hale Shapiro. 2026 ; CE
Another alternative measure comes from the NY Fed’s multivariate core trend that estimates the persistent trend shared across core PCE sectors. Its June reading was 2.8%, with a 2.4–3.2% full confidence band.
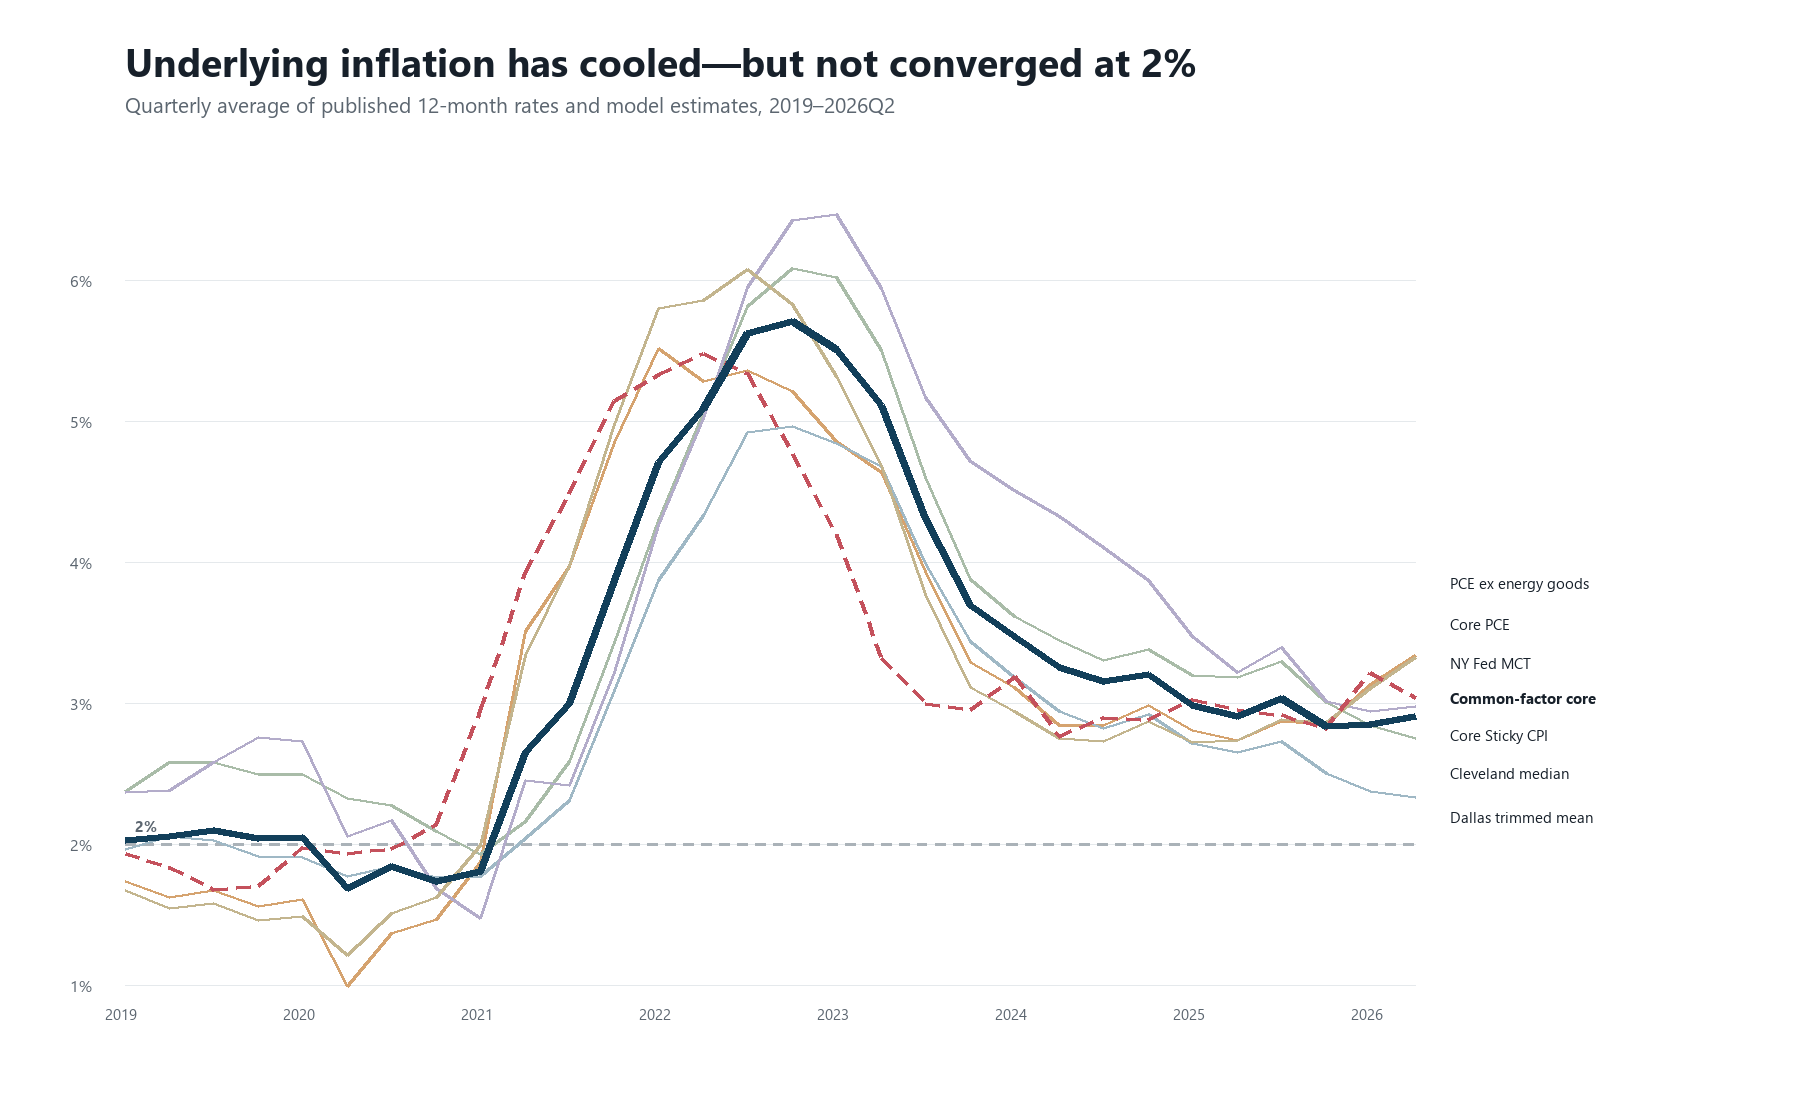
If we also construct our own purely illustrative ‘common factor’ across the various core measures above (other than MCT), we end up with similar conclusions, with a result around the 2.9% rate region. In short, if we currently downplay Dallas trimmed as a potentially flattering outlier, the centre of gravity is all in the mid- to upper-2% zone: off core PCE, but still overall elevated.
A different perspective entirely comes from the new San Francisco Fed’s inflation shock momentum index (ISMI). It is a weighted breadth measure that considers each category-level sub index and determines whether it is rising or falling compared with its trend, resulting in a weighted net diffusion score of upside and downside ‘shocks’ (momentum changes).
On this measure, after a tentative acceleration in the spring, that has now reversed through to June, leaving momentum this year chopping around flat. That is a favourable sign that there is not a fresh inflation shock developing and that this is not another COVID-like generalised acceleration as yet, even with nascent supply issues. However, it is equally not an all-clear either – unless the latest downward momentum print becomes a developed trend - given that even stability in momentum at current rates would leave trend above desired levels.
Figure3: Divergent core trends, common factor types in the mid to high 2%s recently
Source: Various regional Fed, BEA, CE
The upshot of it all is not exactly ‘lies, damn lies and statistics’, but that you can definitely favour the statistical variant that speaks to your own macro interpretation and skew - particularly with respect to supply versus demand balances, what that means for inflation over the trajectory, and in terms of relative-price versus generalised-price trend changes.
Doves will tend to favour the Dallas trimmed and exclude shock-like and hard-to-measure AI effects as price-level shifts or transitory, and will also take comfort in the lack of inflation-momentum acceleration. Hawks will be more concerned about the less aggressively tailed, more basket-representative and better low-variance-to-correlation measures that remain elevated. Pragmatists will tend to view ‘common factor’-type middle grounds as most representative of current dynamics. Fed dissenters such as Logan indeed note that inflation appears to be tending in the mid-2%s, with risks to the upside, and will likely remain there unless policy is tightened or the next shock arrives. This debate is likely to remain at the centre of the Fed’s inflation-data debate and is going to be the key lens through which to view the upcoming inflation data.