Confidence with a K
* Recessionary confidence, resilient spending. Political divisions are evident beneath the headline, but don't explain the macro divergence. High prices part of the story and backed up by micro data research
* Confidence with a K - exceptionally large gap in 'current conditions' sentiment for large equity holders vs non-owners is another part of the equation, as gloom masks different capacities to spend
* Using typical coefficients, equity driven wealth can explain away the gap, and thus highlight crucial importance of this offset mechanism this cycle. Even allowing for wealthier households' lower propensity to consume, large gains help explain strength beyond impact despite the unhappiness.
* That makes financial feedback dynamics even more central to outlook going forward.
Mismatches between US consumer confidence and activity are far from a new thing. But the latest Michigan confidence reading of 46.3, in October’s preliminary data, is nonetheless extreme. Indeed, there were only 12 sub-60 readings between 1980 and 2019, ten of which were during recessions, with the other two when annual GDP growth was below 1%. At present, while some retail measures have started to feel some strain, real consumption was still growing 2.6% year on year in August.
Looking beneath the headlines into the sample data draws out some interesting themes that are backed up by some of the broader macro modelling of the so-called K-shaped economy.
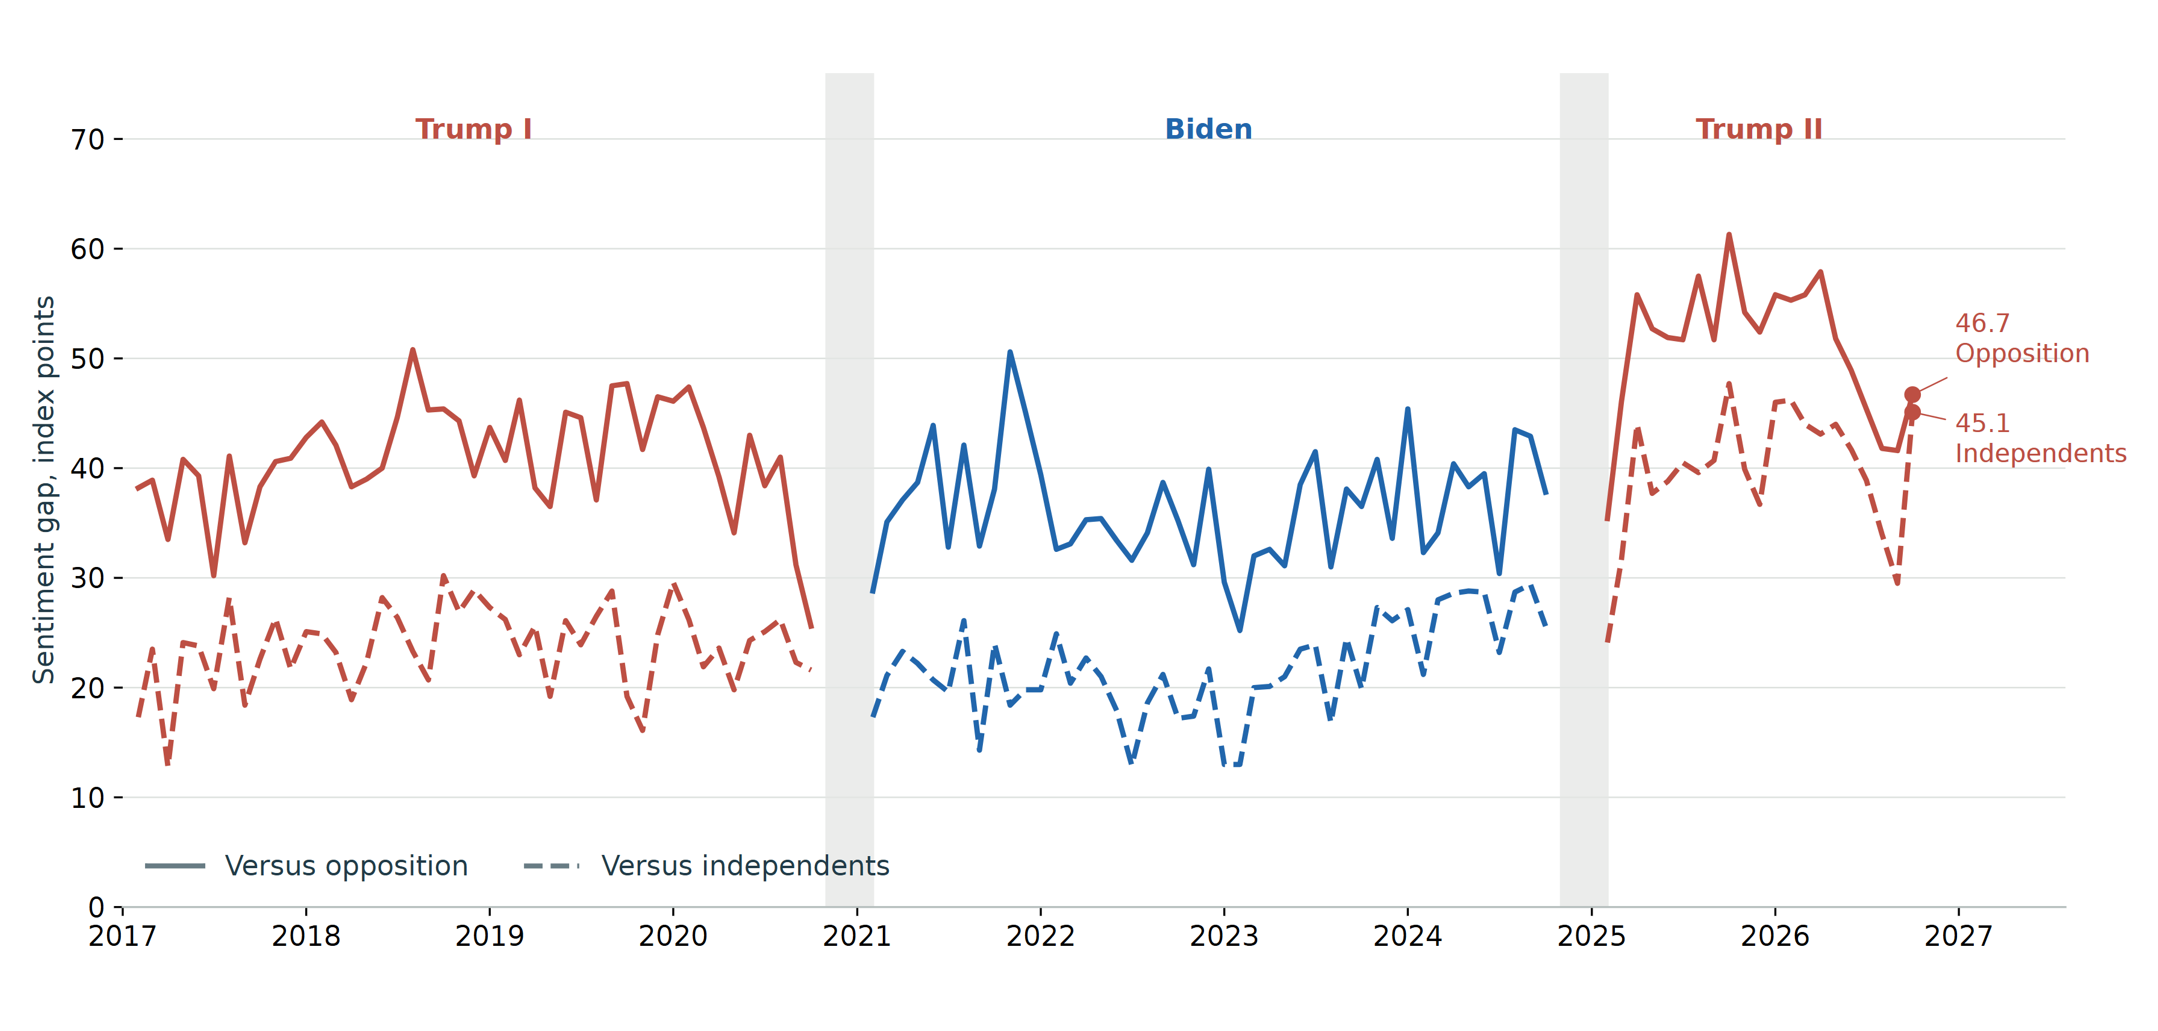
Figure 1: Political confidence split, but not explaining macro divergence
Source: University of Michigan confidence, appendix
Politics is a notable sub-plot but not itself an obvious explanation. The change of president produced the familiar reversal in Republican and Democratic confidence divergence. But the spending disconnect predates Trump’s return, and adjusting for party allegiance does not meaningfully influence the fit. Indeed, if anything, the pattern during Trump’s second term has been one of persistent Republican ‘excess optimism’ relative to independents rather than skewed Democratic pessimism.
In terms of the approach to the midterms, September did see a notable narrowing, with even Republican optimism sharply waning amid the Iran war and high gas prices, although this was reversed in October’s preliminary reading, where weakness was more independents driven.
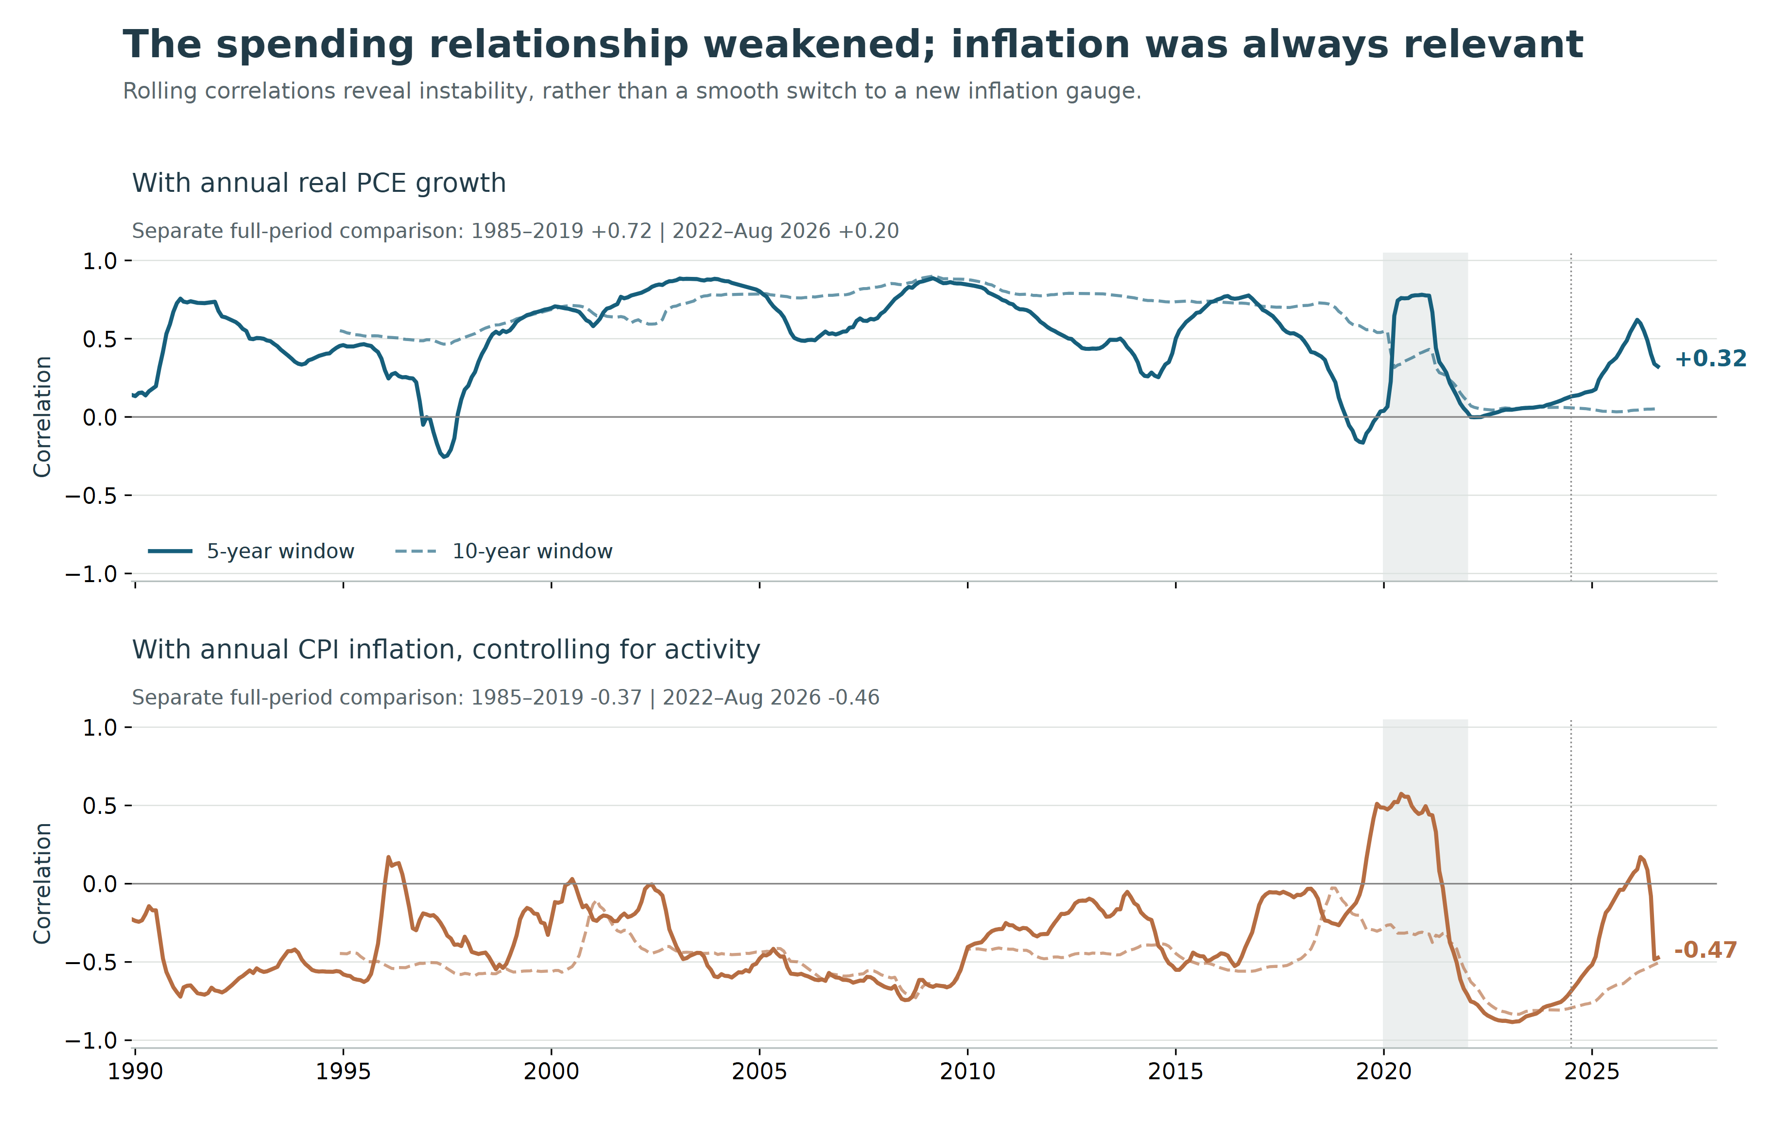
Figure 2: Confidence correlations with spending, prices
Source: University of Michigan consumer confidence; BEA
Inflation and price levels are a more persistent factor. By August, CPI was getting on for a third above its December 2019 level. Fed research using microdata linking sentiment to verified purchases finds that households can report feeling worse even while buying more (see here), due to the perceived exertion needed to maintain living standards and behavioural factors. That helps explain why the survey has been less reliable in recent times and more prone to distortions during ‘cost of living’ eras.
That’s also reflected in the stats. Comparing historical periods, Michigan sentiment’s correlation with annual real consumption growth falls from 0.72 in 1985–2019 to 0.20 in 2022–August 2026. There’s variation over shorter periods, and this doesn’t mean relationships are permanently broken, but it does point to limited reliability at present. Accumulated inflation explains some of the pessimism, but leaves much of it unexplained.
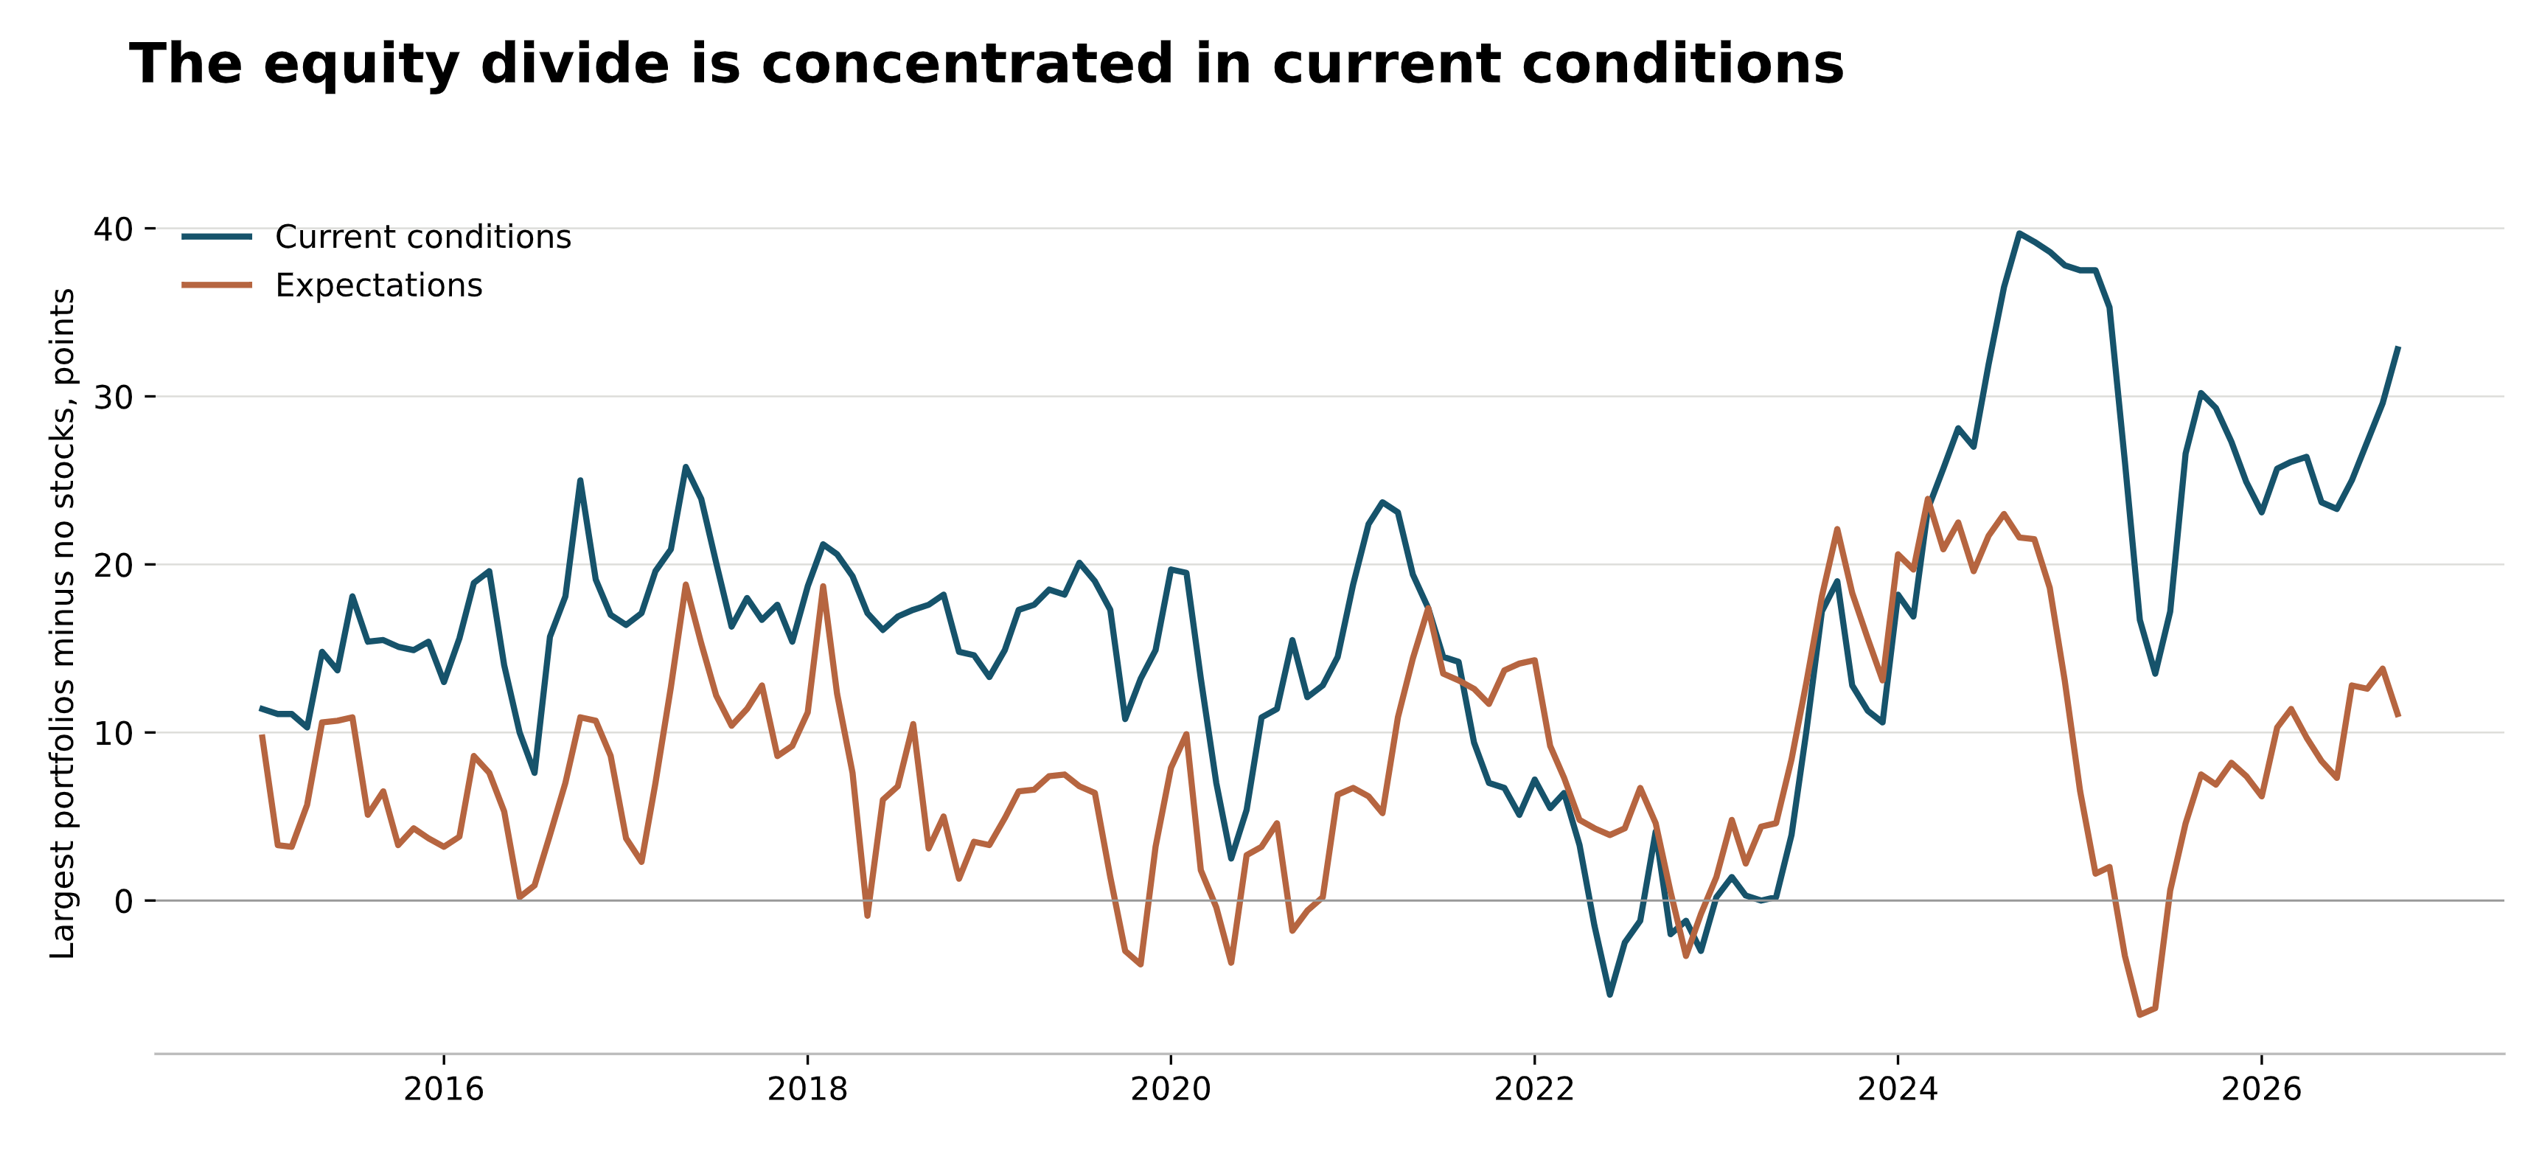
Figure 3: Divergence in confidence by equity holdings
Source: University of Michigan confidence, appendix
The more revealing disaggregation that gels with broader research comes from income and especially wealth segments. The divergence is most distinct in terms of the current-conditions sub-reading for the largest stockholding group versus non-owners - more than twice the pre-pandemic average and around the 97th percentile of the available history. The expectations gap is more within normal bounds, and even large holders express relatively gloomy expectations without that necessarily translating into weaker current spending.
Wider research, such as this Fed paper (here), supports the importance of K-shaped drivers in recent years, with both unequal inflation exposure (higher for low earners) and financial-asset gains as important counterparts to the spending divergence underneath the resilient aggregates.
Updated figures from the Fed’s household accounts show real net worth rising just over 21% for the top income fifth between end-2023 and the second quarter of 2026, against 9% for the other four fifths. The top income fifth held about 84% of the broad equity-wealth measure used here. While other papers document a lower propensity to spend wealth gains among higher-income households, the net dollar effect from strong equity-driven financial conditions is still to prop up aggregate spending volumes via the high wealth spenders. Flow data also give some support to the translation of wealth effects through to spending liquidity: according to the JPMorgan Chase and its account data for instance, positive net investment withdrawals rose from the equivalent of 2.3% of measured checking outflows in April 2015 to 3.5% in April 2019 and 6.8% in April 2026.
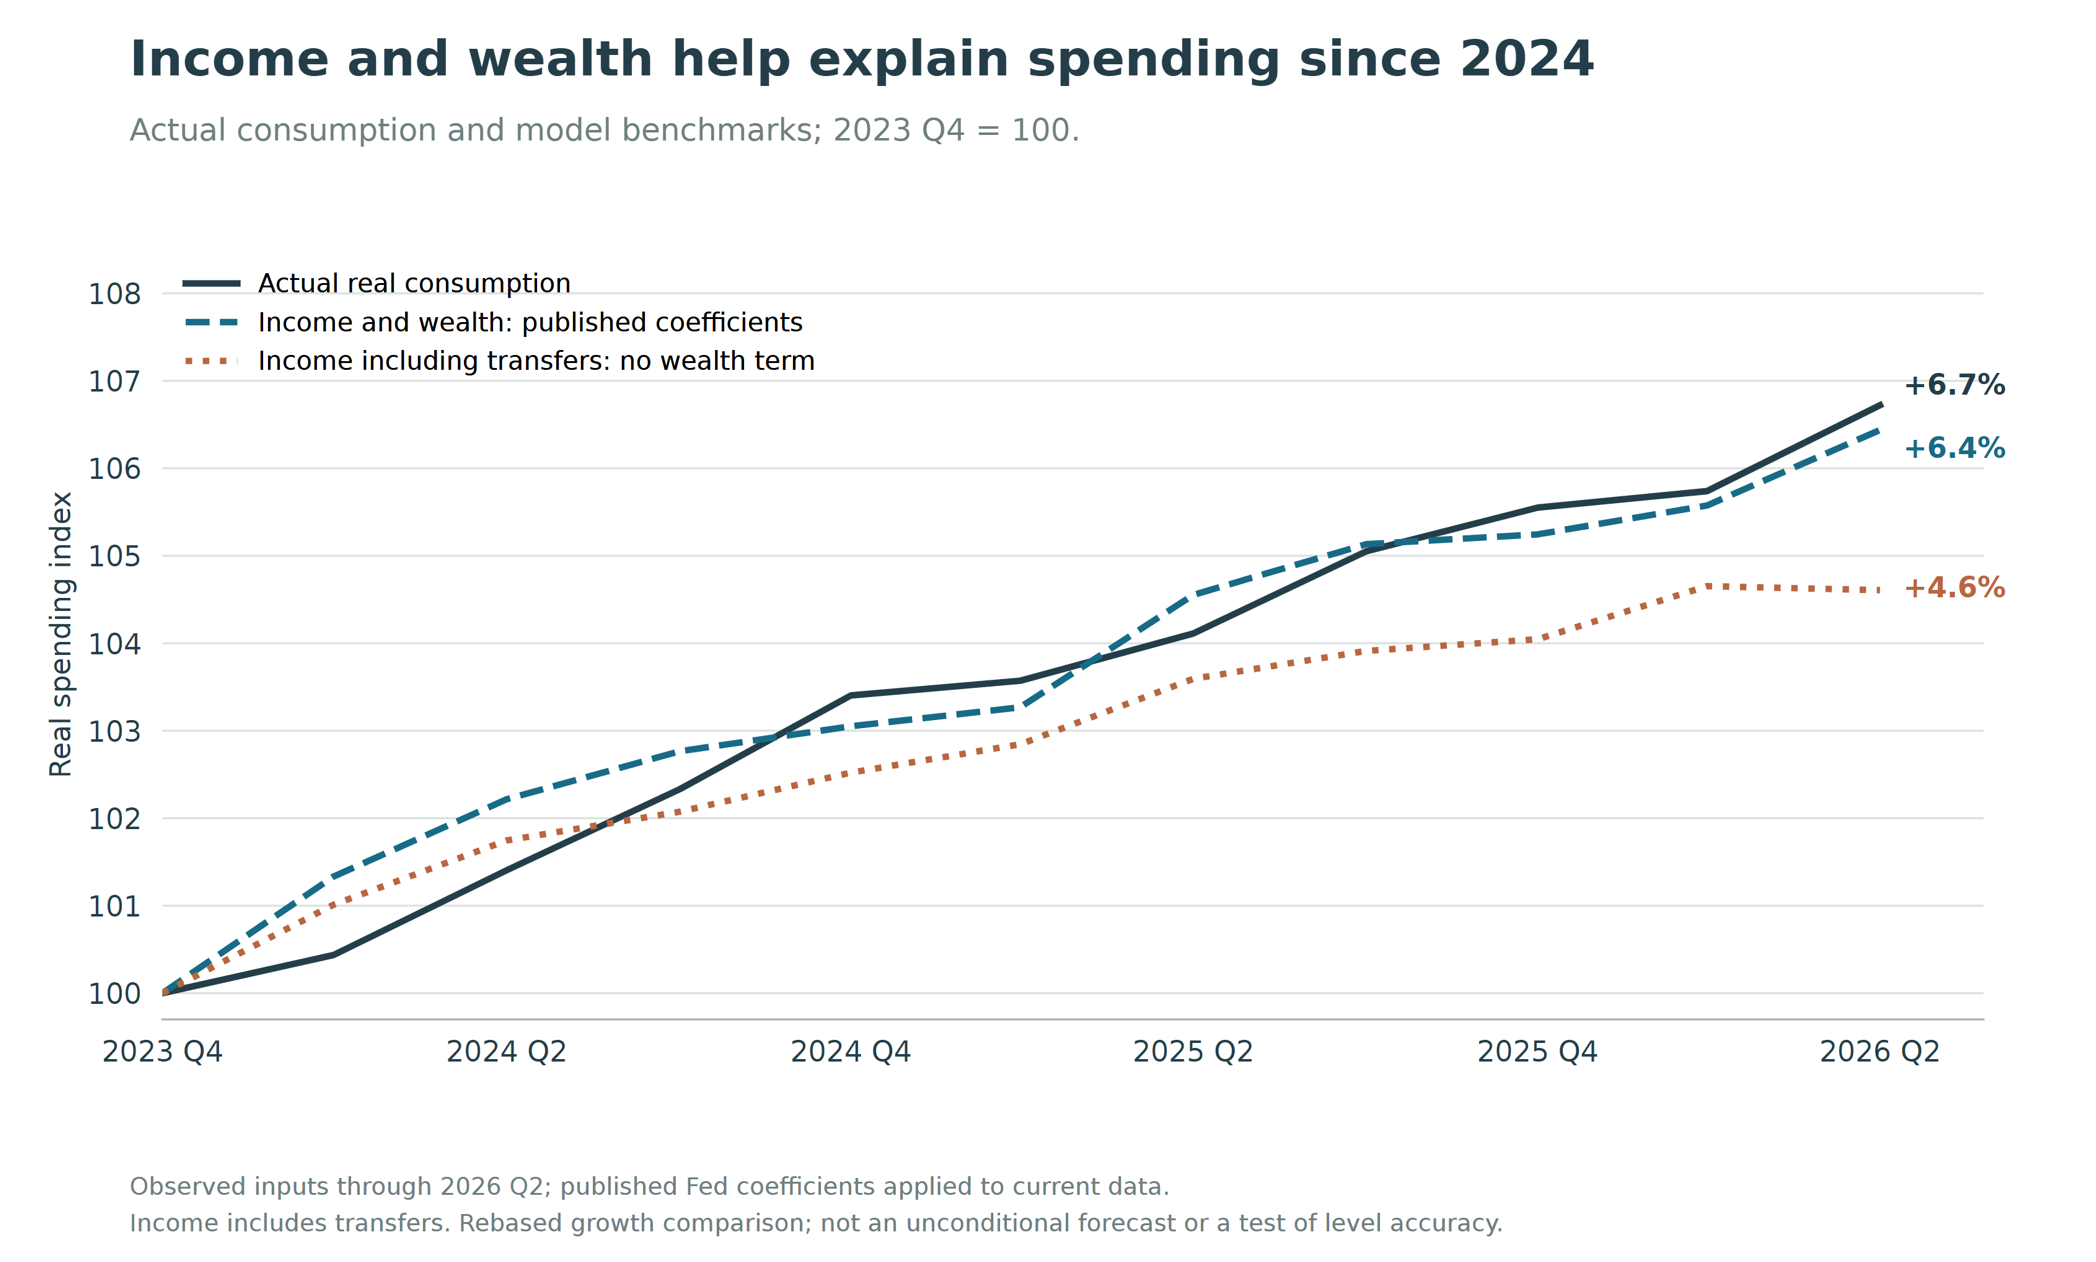
Figure 4: Wealth disaggregated model spending level
Source: FEDS Notes Aug25, Gamber, Moran, coefficients applied to current data
Putting it in a broader macro framing helps corroborate the importance of the equity and wealth channel to this cycle. From end-2023 to Q2, real consumption rose 6.7%. A benchmark based on income alone rises 4.6%. Applying the Fed’s published income-and-wealth coefficients to the observed data produces a 6.4% increase, much closer to actual spending. Indeed, in level terms, spending is actually slightly shy of the model-implied benchmark based on its generic assumptions.
The decomposition makes the drivers more explicit still. Income excluding transfers contributes about 1.6 percentage points to the model’s increase, transfers another 2.4 points, and wealth about 2.4 points. Equities account for 2.1 points of that wealth contribution. These are contributions to the model’s spending benchmark, rather than a precise attribution of what caused actual consumption or the quarterly path. But the results still help to give substance to the disconnect between dire sentiment overall on one side, and the drivers of spending capacity and actual spending growth on the other.
Applying the same consumption model, the wealth contribution is equivalent to roughly 18–22% of the actual increase in real consumption across the selected pre-pandemic intervals, versus 33% since end-2019 and 37% since end-2023 to Q2. These are conditional model-calibrated contributions to level increases, not measured causal effects.
Confidence with a K means the outlook pivots on two co-dependent key drivers from here, given the increased importance of financial gains thus far buffering, at an aggregate level, pressures elsewhere from the AI cycle and energy shock. The tail, to an extent, has been wagging the dog to date.
One, whether cost-of-living pressures, higher interest rates and any potential crowding-out of consumption through AI investment reach a point where they undercut Main Street enough to weaken economy-wide core demand, and so revenue strength and equity resilience (see for instance, at a tangent, here). Labour market stability thus far has allowed dire confidence to co-exist with declining savings and price absorption. And two, partly inter-linked, whether the wealth gains that have propped up spending can continue sufficiently to supplement total spending.