Continuum Economics
  • Search
  • About Us
  • Buy
  • Invite A Friend
  • My Basket
  • Articles
  • Calendar
  • Forecasts
  • Events
  • Data
  • Newsletters
  • My Alerts
  • Community
  • Directory
  • About Us
  • Buy
  • Invite A Friend
  • My Basket
  • Articles
    • All
    • Thematic
    • Tactical
    • Asia
    • EMEA
    • Americas
    • Newsletters
    • Freemium
    • Editor's Choice
    • Most Viewed
    • Most Shared
    • Most Liked
  • Calendar
    • Interactive
      • China
      • United States
      • Eurozone
      • United Kingdom
    • Month Ahead
    • Reviews
    • Previews
  • Forecasts
    • Forecasts
    • Key Views
  • Events
    • Media
    • Webinars
  • Data
    • Country Insights
    • Shadow Credit Ratings
    • Full CI Data Download
  • Newsletters
  • My Alerts
  • Community
    • FX
    • Fixed Income
    • Macro Strategy
    • Credit Markets
    • Equities
    • Commodities
    • Precious Metals
    • Renewables
  • Directory
  • My Account
  • Notifications Setup
  • Administration Panel
  • Account Details
  • Recent Devices
  • Distribution Lists
  • Shared Free Trials
  • Saved Articles
  • Shared Alerts
  • My Posts
Back
Published: 2026-05-28T14:22:20.000Z

U.S. April New Home Sales - A below trend month

1

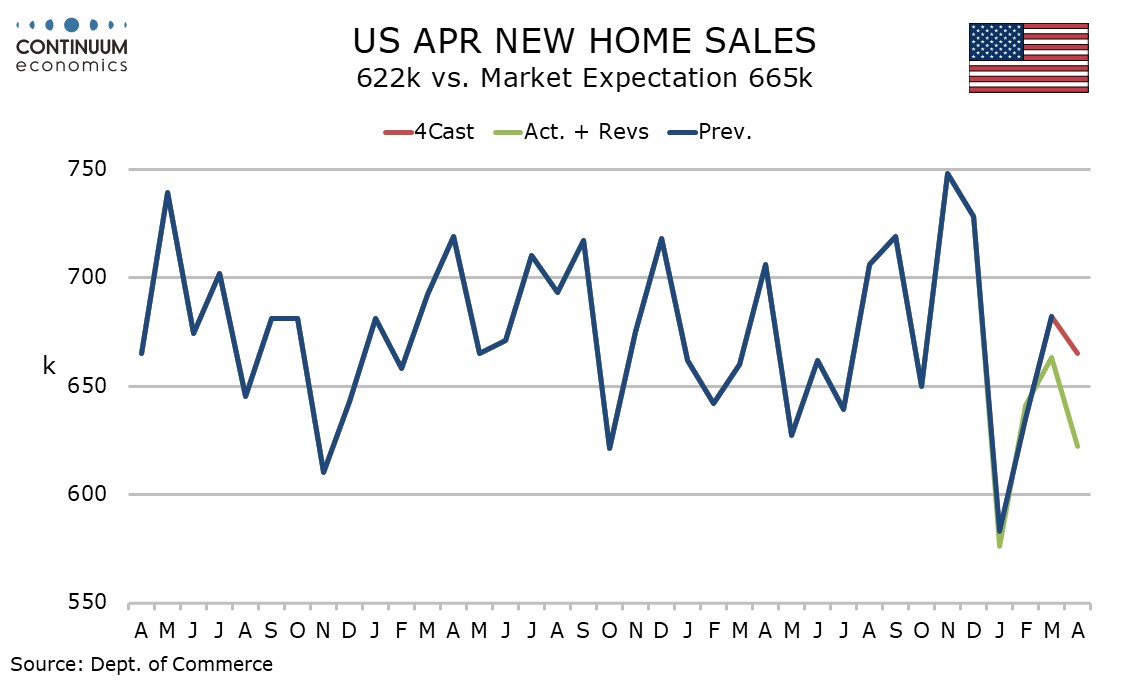
April new home sales with a 6.2% decline to 622k are on the weak side of trend which is showing signs of losing momentum, if not dramatically yet. That May’s NAHB homebuilders’ index picked up from a weak April cautions against reading too much into this data.

Trend in new home sales has been mostly between 650k and 700k, though we had some recent volatility with sales reaching 748k in November assisted by the resumption of Fed easing and falling to 576k in January with weather probably exaggerating the correction lower. Barring January April’s data is the weakest since October 2024 with weather not an easy excuse to make this time.
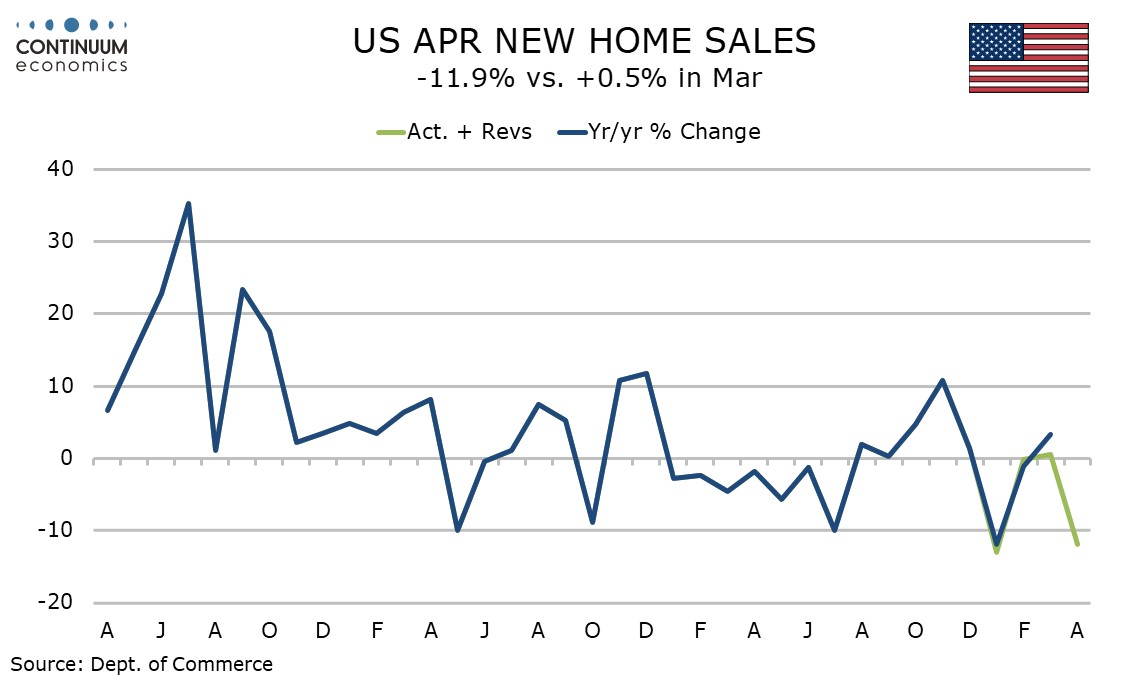
Sales are down 11.9% yr/yr after being near flat in February and March. This suggests fading expectations for Fed easing are weighing on the market but conclusions should be tentative on one month of data. On the month sales fell in three of the four regions, the exception being the West.
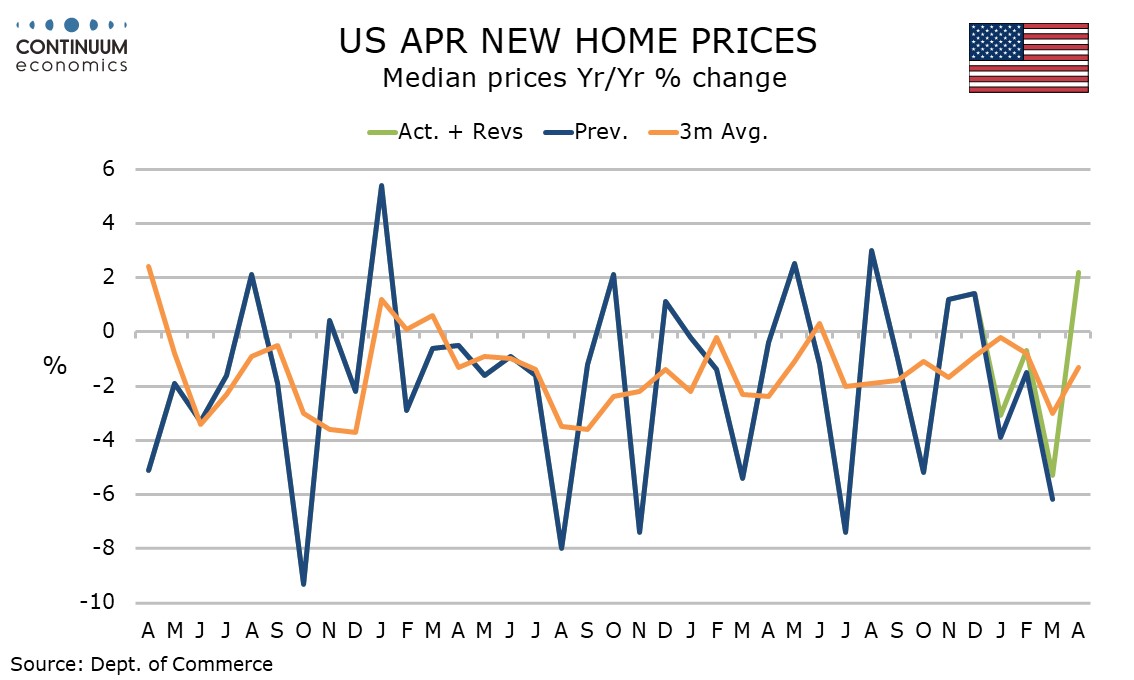
The median price saw a strong monthly rise of 8.0% seeing yr/yr growth picking up to 2.2% from -5.3% in March.
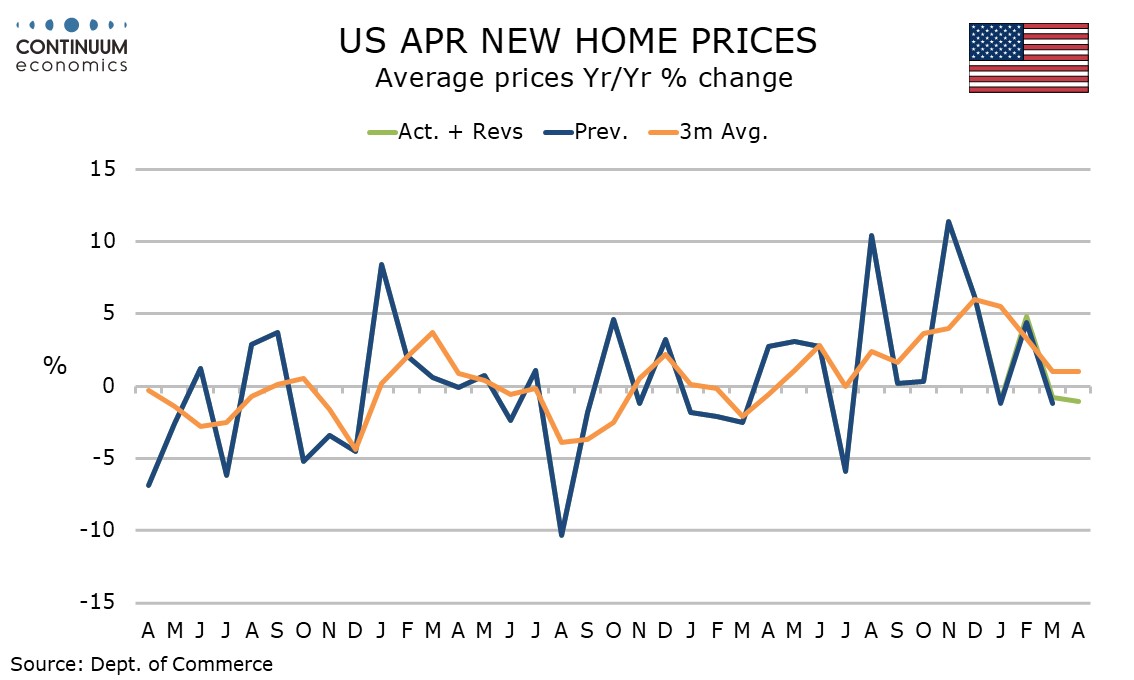
The average price saw only a 0.7% rise on the month, with yr/yr growth slipping to -1.1% from -0.8%. This is probably more in line with the underlying picture. Most house price indicators have been losing momentum in recent months.
Continue to read the article for free
Login

or

or

Topics
Data
Foreign Exchange
Data Reviews

GENERAL

  • Home
  • About Us
  • Our Team
  • Careers

LEGAL

  • Terms and Conditions
  • Privacy Policy
  • Compliance
  • GDPR

GET IN TOUCH

  • Contact Us
Continuum Economics
The Technical Analyst Awards Winner 2021
The Technical Analyst Awards Finalist 2020

© 2026 Continuum Economics

image