Kiwi longs as a contrary indicator
Mkt turned long NZD in latest IMM week
That has tended to prove a contrary indicator rather than a bullish one more often than not
Descriptive stats show a skew towards downside kiwi corrections in the following window
May also be suggestive of wider current risk positioning in FX
The latest IMM data showed the spec market turning long NZD for the first time since July-25, and before that Oct-24.
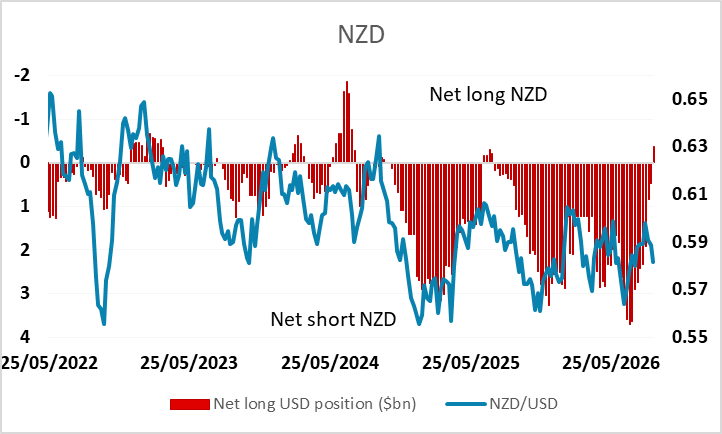
What stands out however is the impression that this flip long looks more of a 'contrary indicator' for the market rather than a bullish trigger.
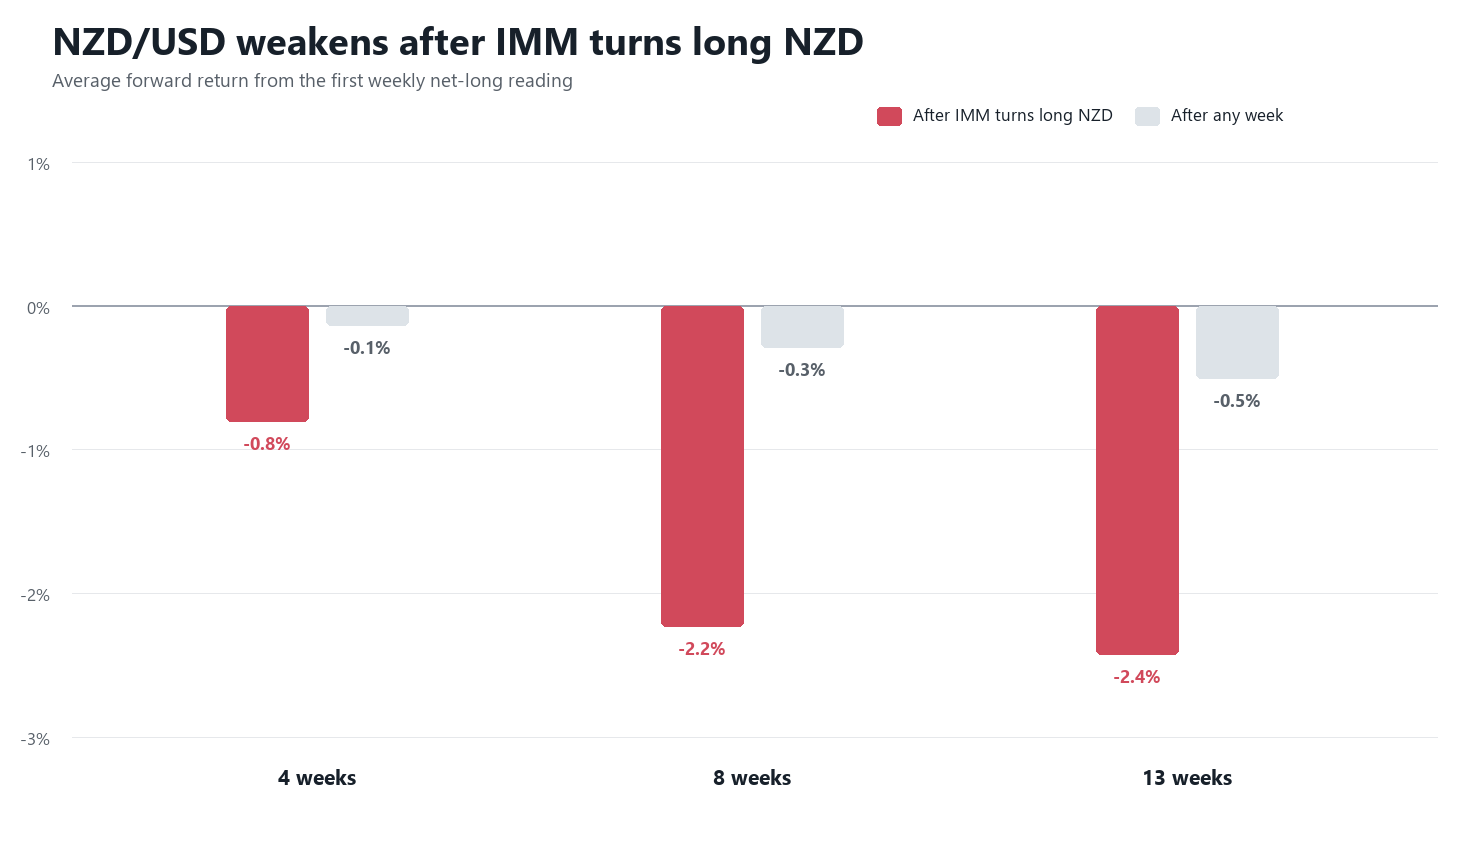
Generating some basic automated descriptive statistics broadly supports the casual observation, especially over a 2-3 month window, albeit across a limited number of instances over the last 15 years (32 prior)
Eight weeks on from the flip, NZD/USD was lower 3/4 of the time, with a typical decline in the 2%s. Declines are also lower than standard for any week over the sample.
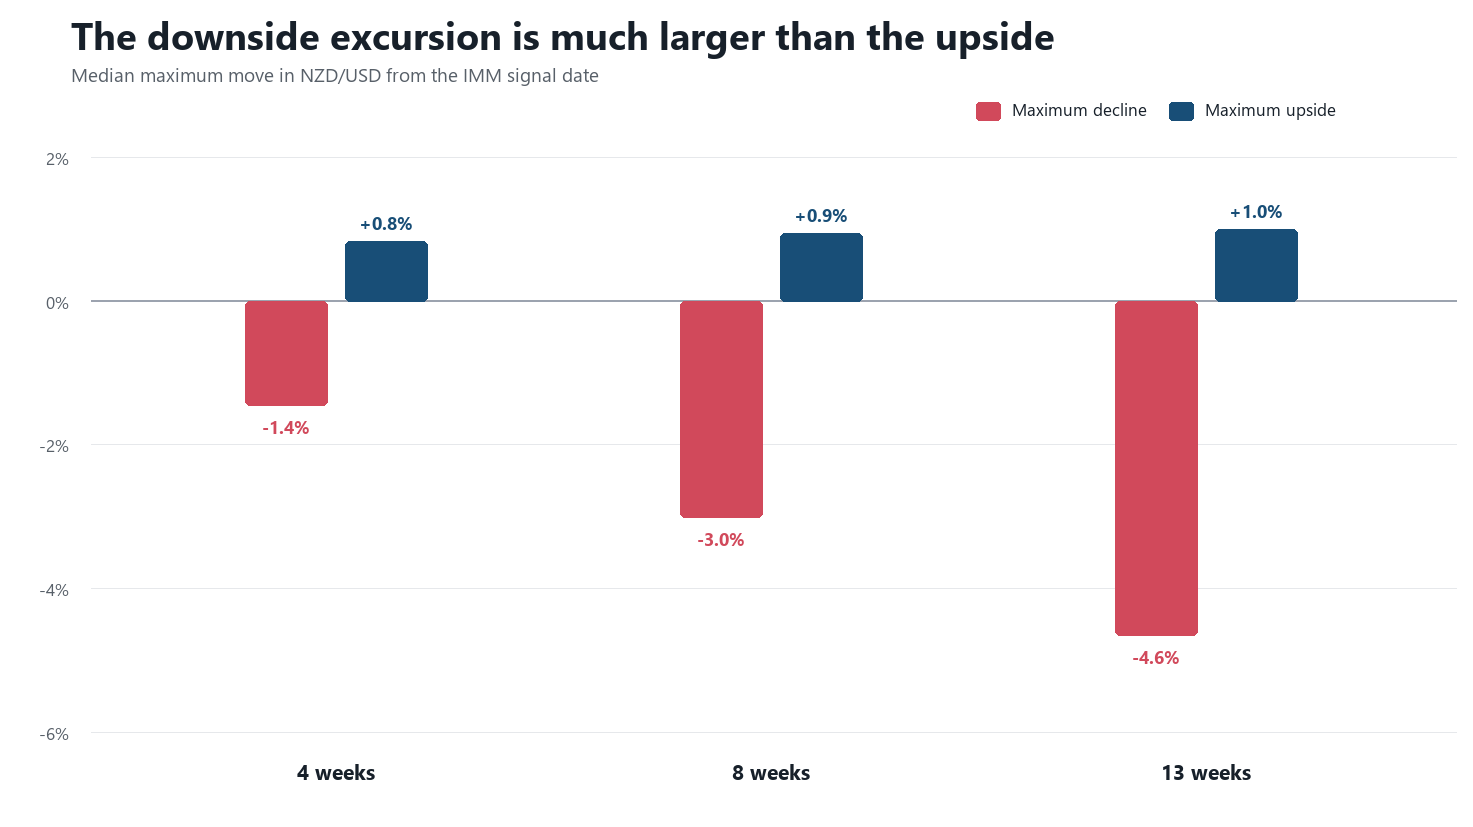
In drawdown terms, within 13 weeks, the median peak decline was just shy of 5% vs a maximum upside extension of 1%. More than 4/5 instances saw a decline of at least 2%, while 2/5 saw a decline of over 5%.
For individual instances, the largest standalone peak declines were 5.5%~ in 4 weeks and 9-11% in 8 to 13 weeks (ex pandemic). Again, in terms of individual results, max follow though were in the order of 3-4% out to 8 weeks, somewhat larger out to 13 weeks.
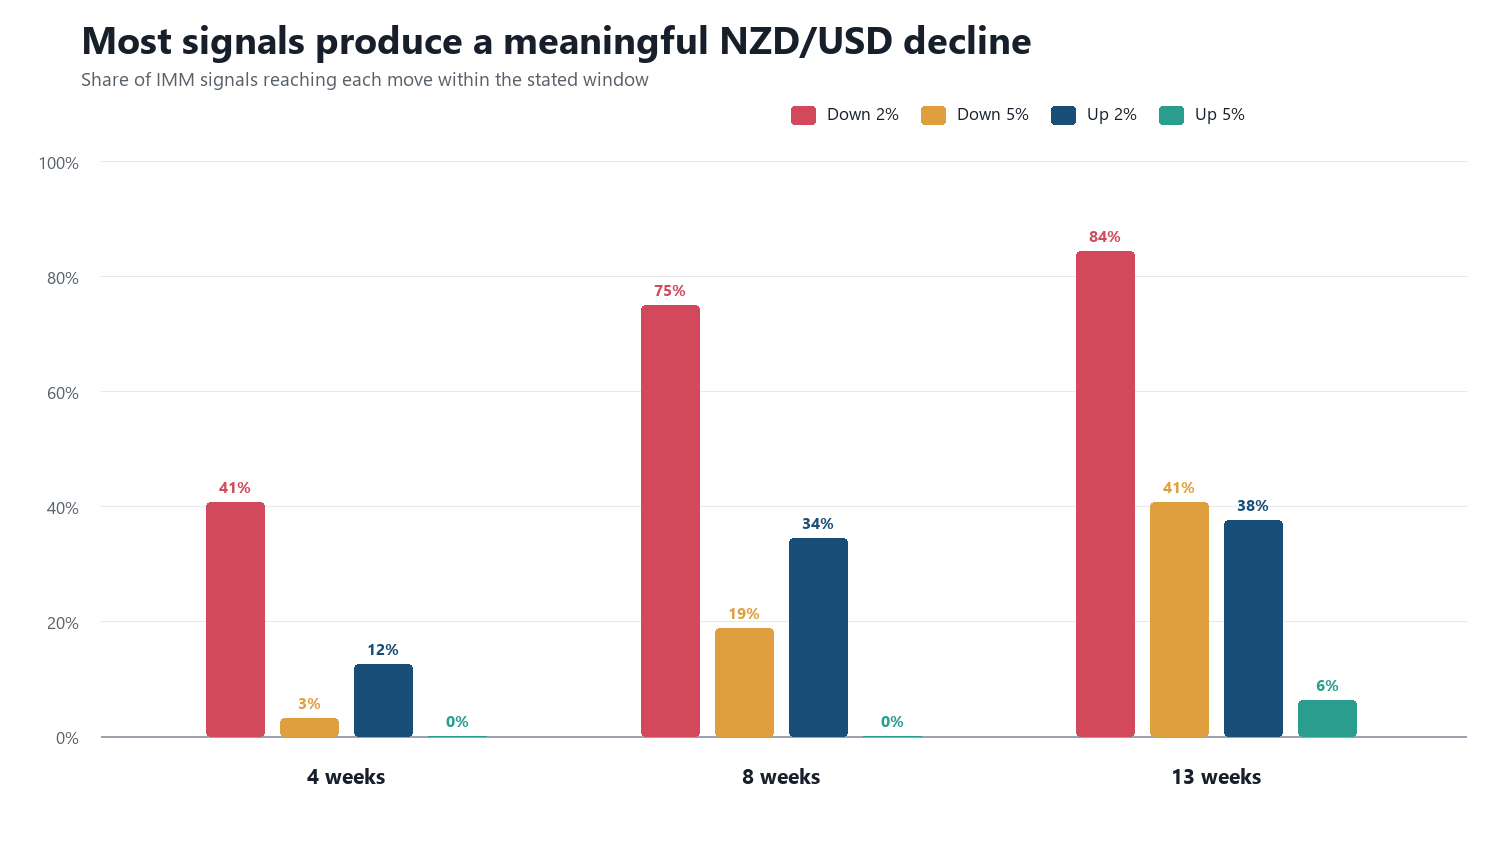
These are just general stats and don't dictate direction, but do support the broad impression that the turn last week actually marked something of a prior short-term excess in bullishness (both for the kiwi but perhaps for risk in general). This is looking to be supported by current price action, albeit with news, especially geopolitical, acting as an amplifier.
Anecdotally then it supports a general defensive mood at present as FX risk positions, including NZD, look to be seeing some positional pressure after a period of bullish resilience.