This week's five highlights
DM Government Bond Markets in Limbo
U.S. Consumers look vulnerable
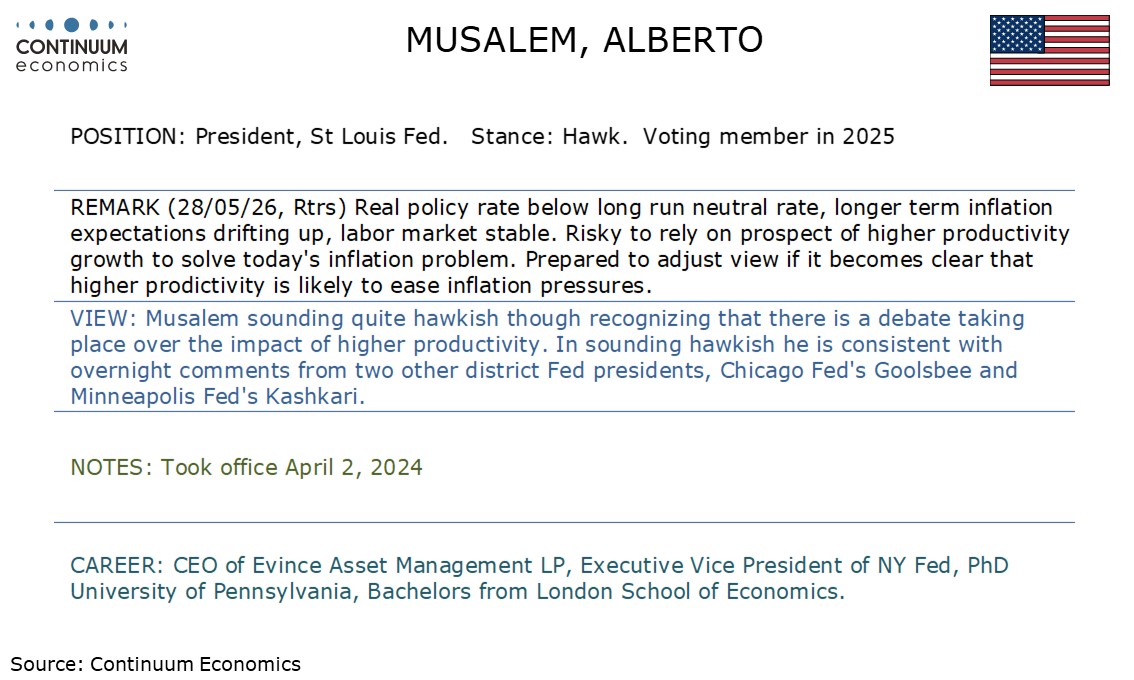
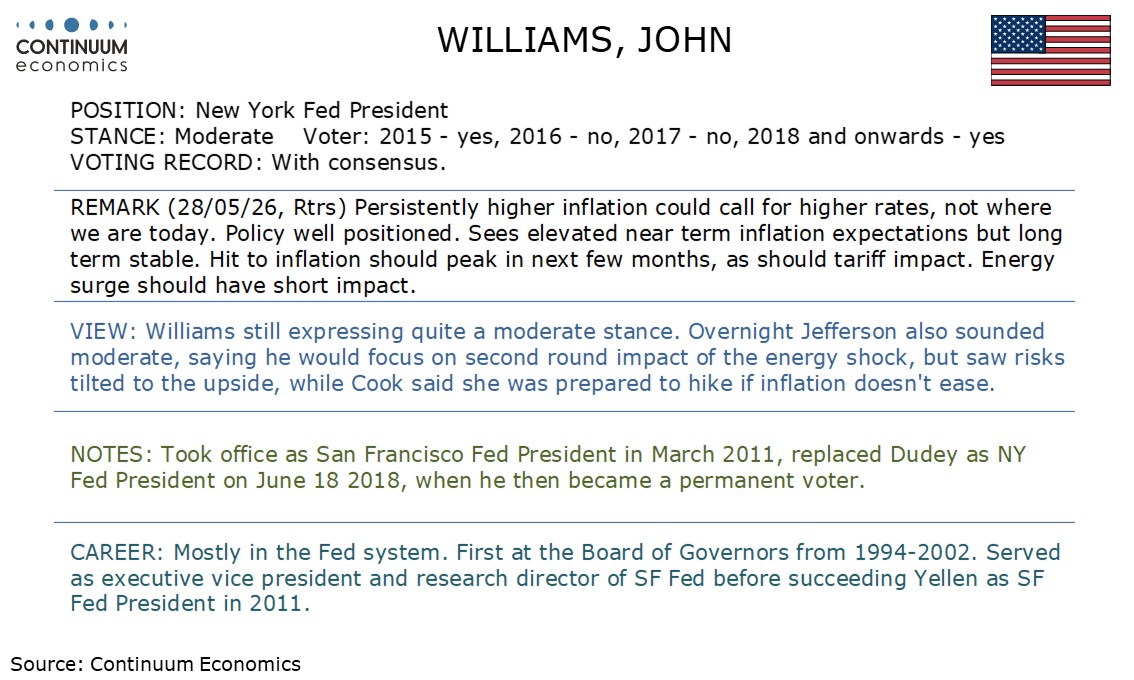
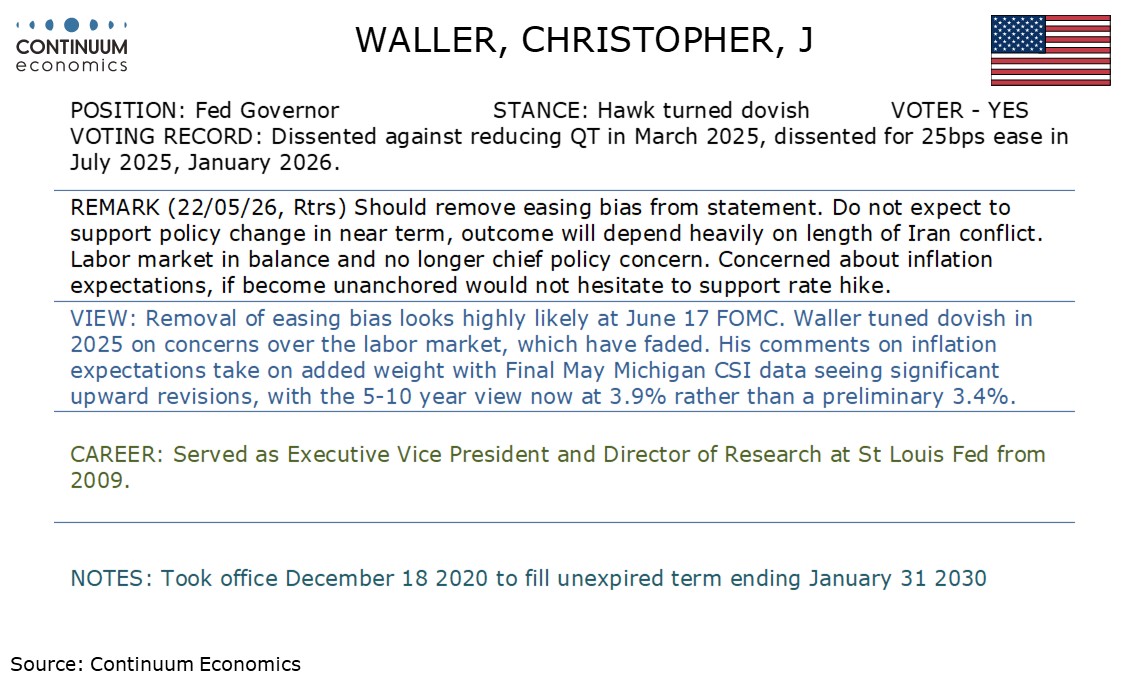
This Week's Fed Speakers
Hawkish Split within RBNZ
ECB Not Willing to Look Through Energy Shock?
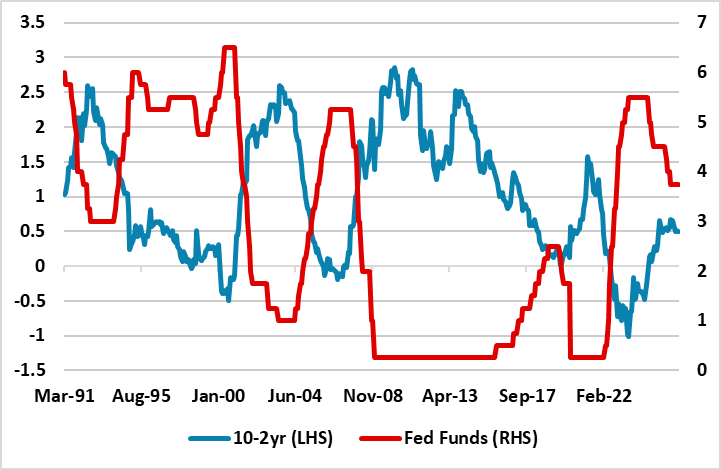
Figure: U.S. 10-2yr and Inverted Fed Funds (%)
Source: Datastream/Continuum Economics
Rising U.S. government bond yields since the outbreak of the Iran war have prompted apprehension of yet further yield rises. However, we would see it more reflecting a swing to discounting rate hikes and risk premium. If the market was really concerned about persistent inflation then the 10-2yr curve should steepen. Instead, a marginal flatten 10-2yr has been seen since the Feb 28 start of the U.S./Iran war and this is consistent with historical behaviour when the market swings to flatten when the market swings from easing to tightening expectations (Figure). Though money markets are now discounting a set of hikes from the Fed, incoming economic numbers will be crucial, both in terms of CPI inflation trends and the next NFP report. Interrelated to this is whether low to middle income consumers become more cautious in the face of the new CPI shock (here). Add in new Fed chair Warsh’s bias to ease on AI driving disinflation and it remains unlikely that the June 17 FOMC meeting will see the Fed actually hike. Even so, the FOMC meeting dots will be important alongside the statement (whether the easing bias is dropped) in setting expectations at the front-end and across the curve. It could be that the June FOMC itself does not bring relief to high U.S. Treasury yields.
The key swing factor are actually negotiations over reopening the Straits of Hormuz. Our baseline remains that the U.S. and Iran do not want to restart the war and have economic incentives to agree a reopening of the Straits of Hormuz by July (here). If this comes before the FOMC meeting, then it will calm FOMC members and also the U.S. Treasury market.
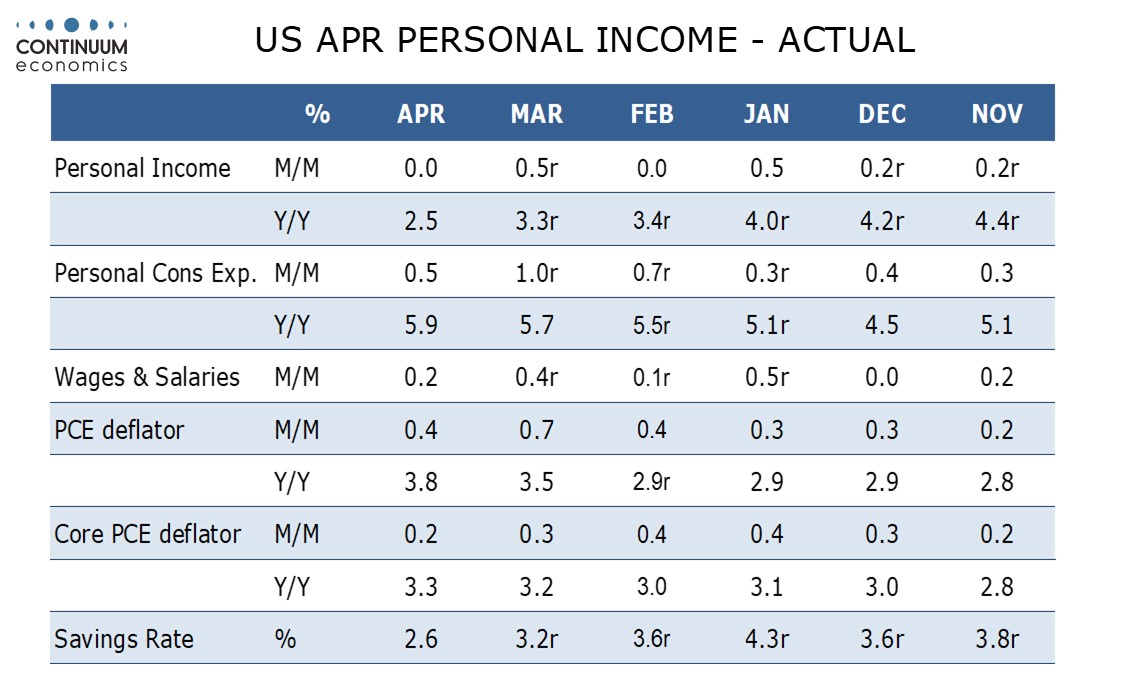
The latest US data can be seen as on balance softer than expected, with a falling savings ratio in April suggesting downside risks to consumers, with consumer spending with inventories bringing a downward revision to Q1 GDP. Core PCE prices were softer than expected in April but revised up in Q1. April durable goods orders were mostly strong, but initial claims have moved up from recent lows.
April personal income was unchanged with real disposable income down by 0.5%, significantly underperforming consumer spending which rose by 0.5% in nominal and 0.1% in real terms. Both income and spending were revised lower in Q1, real spending to 1.4% annualized from 1.6% and real disposable income to 0.7% from 1.1%, with Q4 revised to 1.0% from 1.3%.
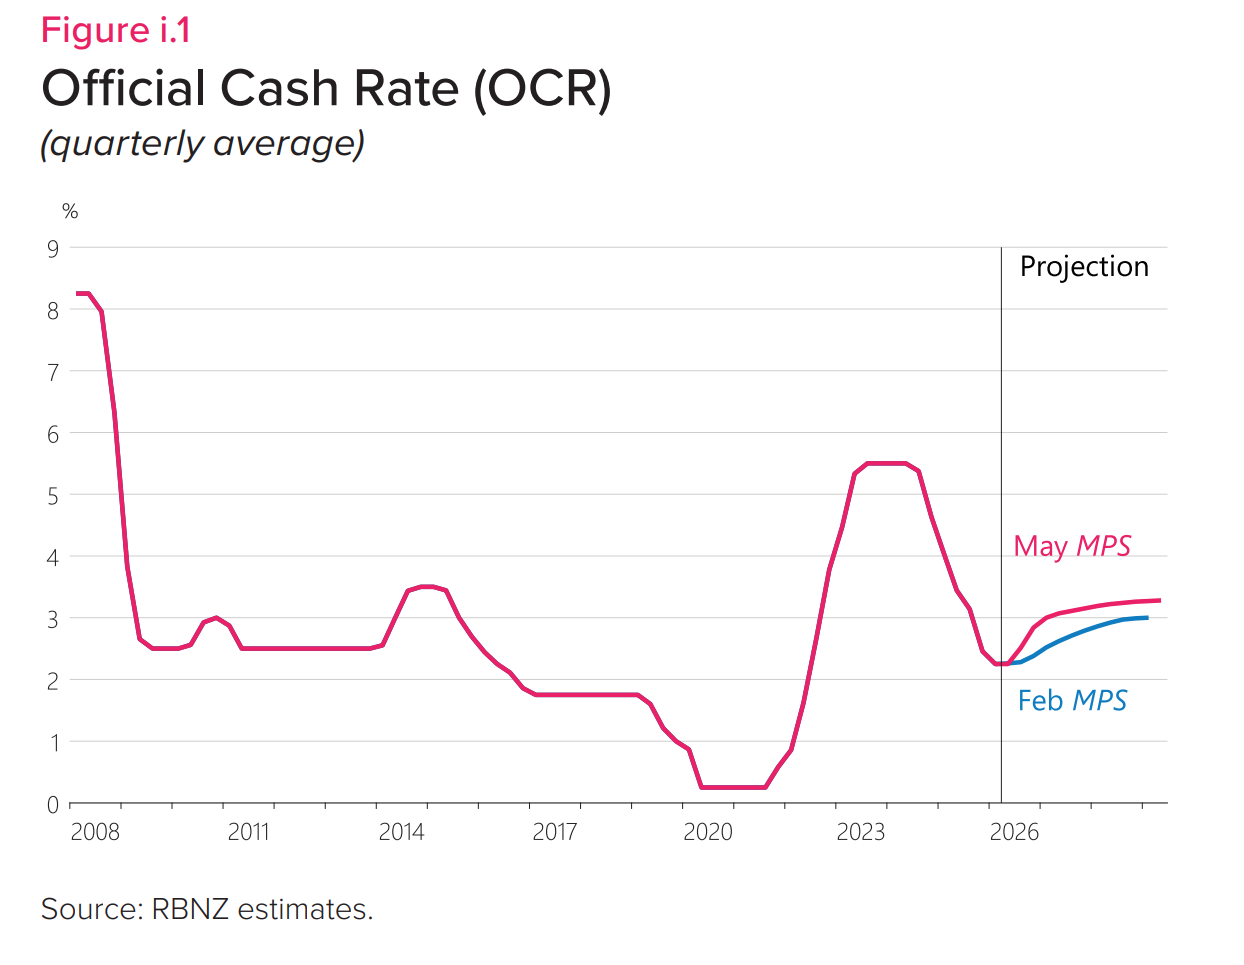
The RBNZ kept rates unchanged at 2.25% in the May meeting but on a hawkish 4-3 vote. Governor Breman broke the tie to keep rates at 2.25%. The OCR path is revised significantly higher from February forecast, around 2 hikes higher by year end 2026. They still see inflation returning to target range in mid 2027 but expecting above 4% in 2026.
The uncertainty in Middle East remains and could extend beyond their baseline scenario of easing in June. It has led to inflation forecast for 2026 to be above 4%. If higher oil prices are here for longer, the RBNZ projected CPI could go as high as 5.8% y/y.
Three members of the RBNZ committee voted to hike rates by 25bps, citing energy shock could translate into more broad based inflationary pressure soon and the NZ's fiscal condition would still remain accommodative. Three members also voted to hold, emphasizing that "core inflation and wage growth remain contained and medium- and long-term inflation expectations remain around 2 percent." They argued that the current uncertainty would already curb secondary inflation effect. But all members agreed that increasing the OCR is necessary in coming meetings to keep inflation in check.
Figure: Service and Factory Sector Selling Price Expectations Backing Off?
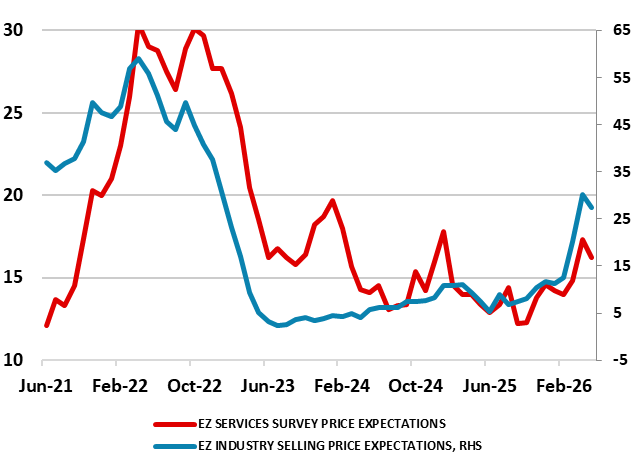
The Account of the April 30 ECB meeting offers few added clues with comments from Council member since more directly suggesting a precautionary if not pre-emptive 25 bp rate hike on June 11. As was case back then, markets are seeing two such moves by September and a strong probability of a third by December. We think that the June meeting hike is now a done deal, with the April decision actually having been a close call to some members. But we remain wary about both the size, timing and durability of any subsequent hikes, not least amid what have been soggier real economy numbers that will only accentuate ECB concerns that markets have a dissonance with the current pricing of energy. Even so, compared to late April, it is worth noting that the energy backdrop currently has eased with gas prices largely in line with ECB March projection thinking while oil prices have fallen almost 20% from the highs they saw then. Moreover, while the ECB has asserted that its statistical techniques point to higher core inflation, we note data very much to the contrary (Figure).