This week's five highlights
Strait of Hormuz Scenarios
U.S. Equity-Treasury Strains and Risk
ECB Hikes by 25bp to 2.5%
U.S. August PPI Near consensus
USD/JPY Consolidating at 153.00
Figure: WTI Oil Price Projections (USD)
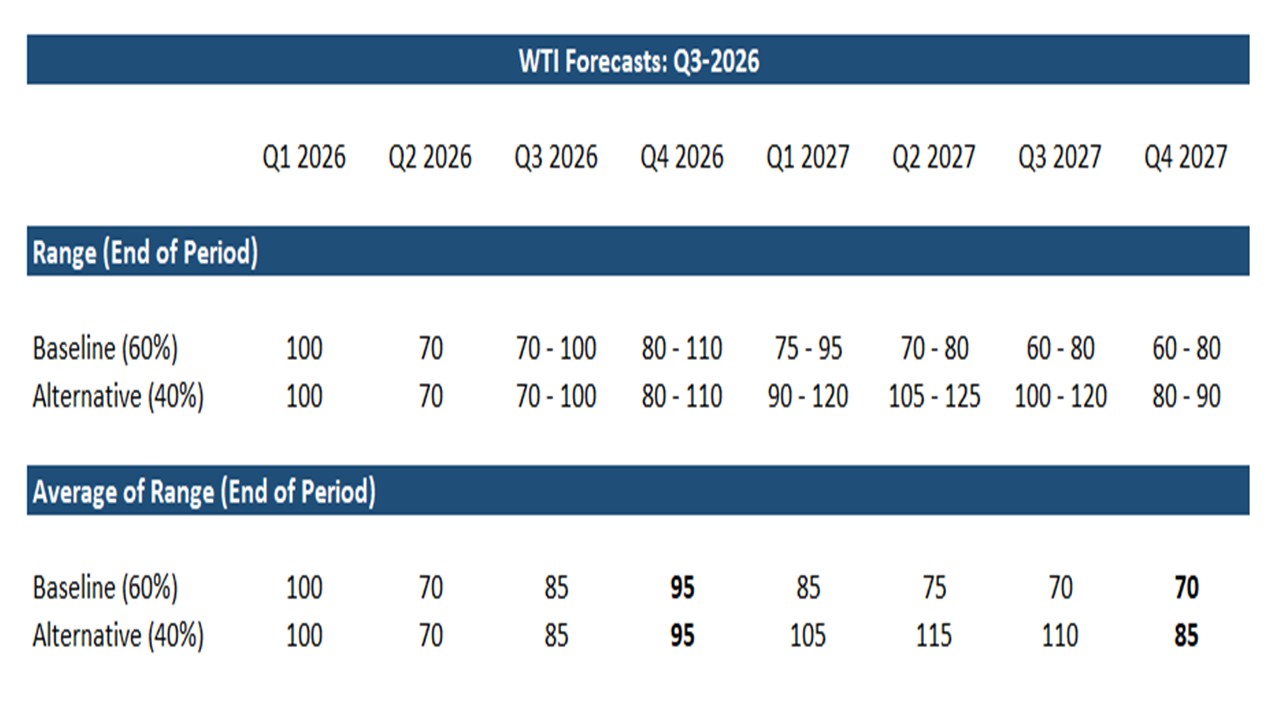
Our new baseline (60%) is for a new ceasefire deal into Q4 2026 or Q1 2027 that allows more shipping to pass through the Strait of Hormuz. We feel that economic pressure on Iran remains intense and that Iran will want to lift the U.S. blockade on its energy shipments and export revenue. The Trump administration has more acute political pressure, as the prolonged high level of gasoline and diesel prices is further hurting the Republicans before the mid-term election. The alternative scenario (40%) is that some of Iran hardliners objectives (having a frozen war to stop another full scale attack and try to build a nuclear weapon) could mean that they are unwilling to reach a further ceasefire deal until well into 2027 or at all. Figure 1 outlines are revised WTI oil price forecasts.
Figure: 12mth Fwd S&P500 P/E Ratio and 10yr Real U.S. Treasury Yield Inverted (Ratio and %)
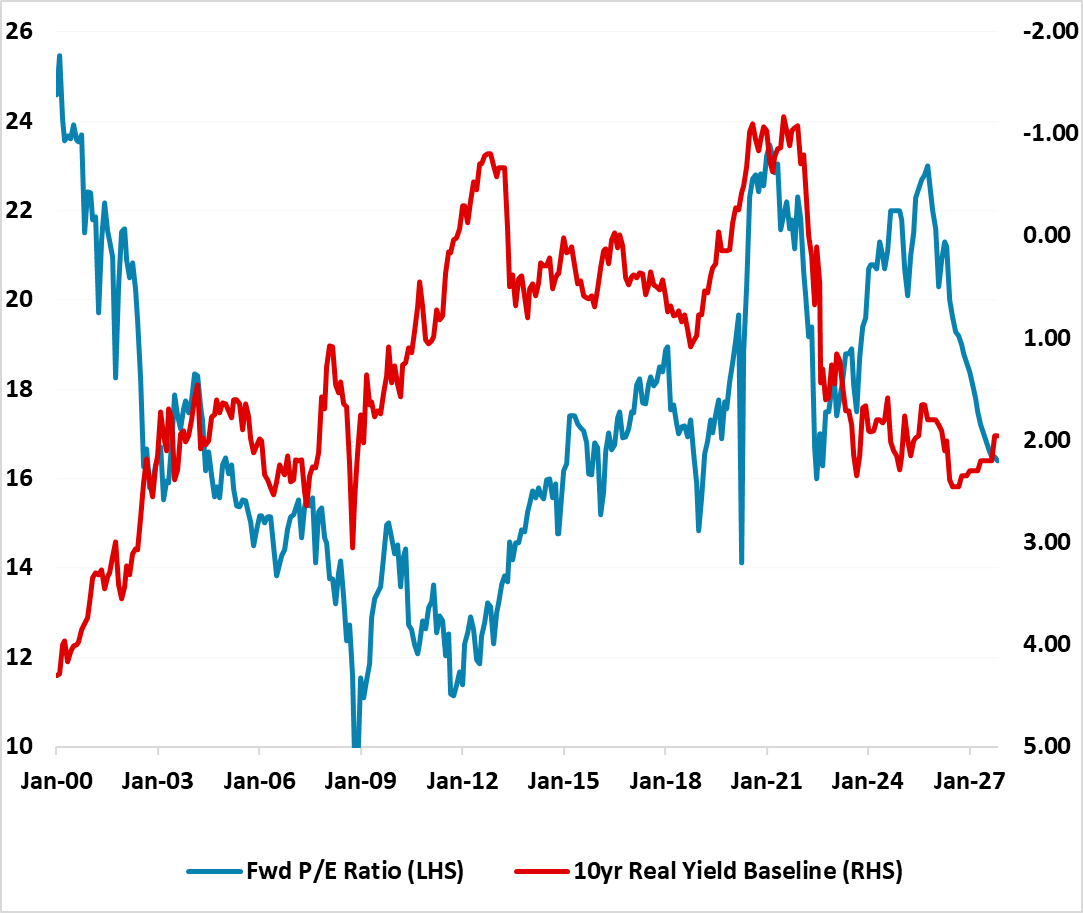
The U.S. Equity market is treading water in the face of higher 10-30yr U.S. Treasury yields and rising fears that the Fed could tighten in September or October by 25bps – though 25bps is only fully discounted in December and a further 25bps in April 2027. A couple of points are worth making.
Equity investors have taken note of higher U.S. Treasury yields, but the influence of the AI boom and corporate earnings is greater. Nevertheless, the U.S. equity market valuation means that it is stretched currently versus the U.S. Treasury market and could be hurt by moderate bad news. Examples of moderate bad news would be Open AI IPO getting delayed from the autumn into 2027; moderate bad news from the one of the hyperscalers, which causes an amplified correction due to shrinking free cash flows in the sector or thirdly slowing consumption growth outside the top 20% of U.S. households producing a lop sided U.S. economy that see non tech sector corporate earnings hurt.
Figure: ECB New Projections
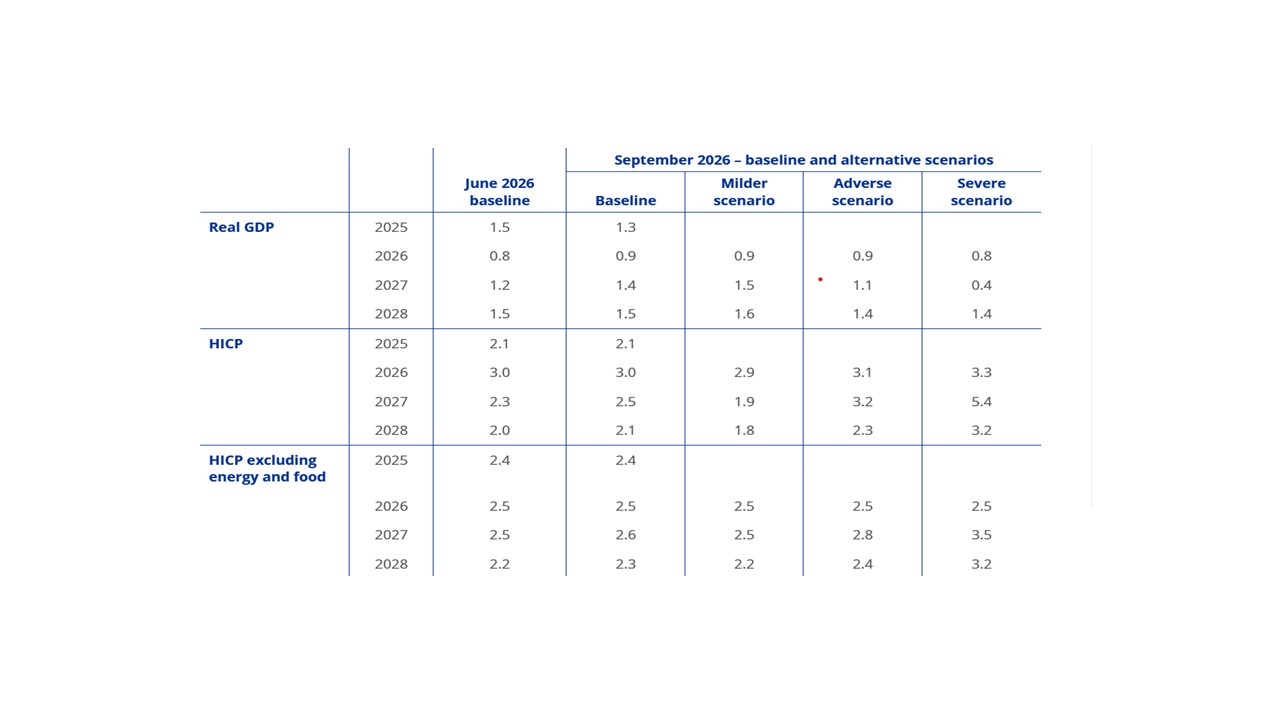
Today’s decision to increase the deposit rate by 25bp to 2.5% came as no surprise given the uptick in headline euro area inflation, the energy market backdrop and recent comments from ECB members. President Lagarde in the press confidence said that today’s increase was a “no brainer” and a “unanimous decision” by the Governing Council. The ECB continues to be data dependent but does not seem rushed to validate the current market expectation of 2 hikes in December 2026 and March 2027 -- the 3rd 25bps hike in Oct 27 money market futures appears a spillover from the rise in government bond yields.
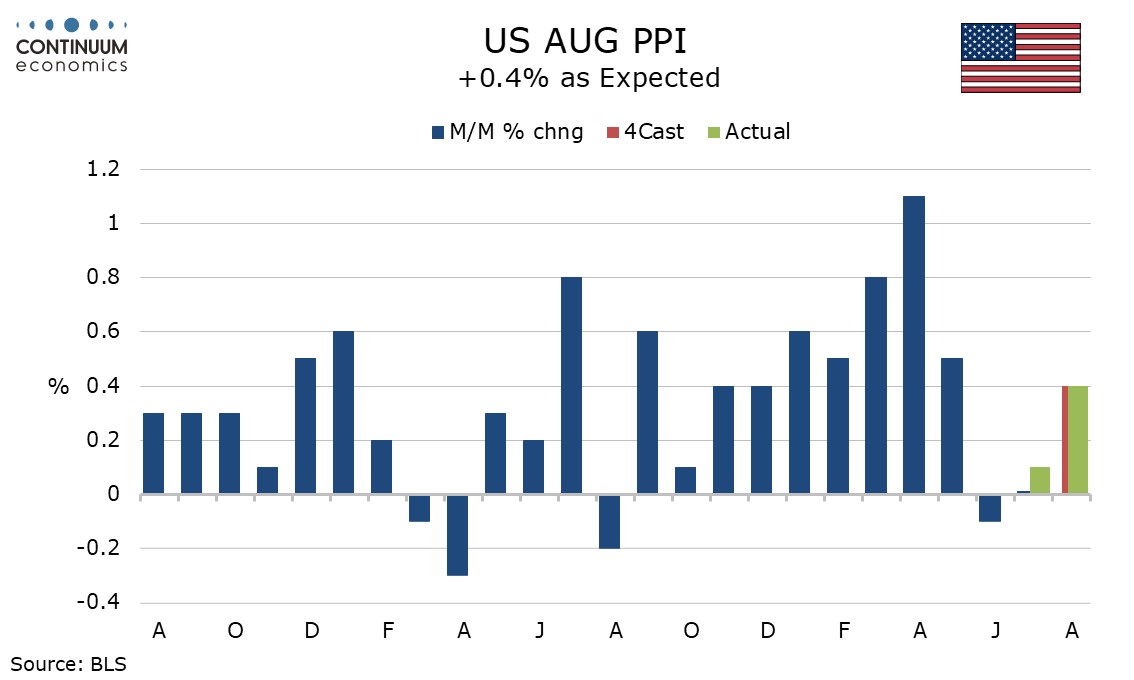
August PPI is in line with expectations, up 0.4% overall, and a moderate 0.2% ex food and energy. A 0.3% rise ex food, energy and trade suggests underlying trends are still a little firmer than the Fed would like. Initial claims at 206k versus 207k and continued claims at 1.774m versus 1.775m are virtually unchanged and suggest a very stable labor market.
In the PPI, food saw a marginal 0.1% increase after two straight significant declines and does not appear to be a concern. Energy however picked up by 4.2% after two straight declines and recent developments in the Middle East suggest more may be to come.

Bounce see the 155.00 and 155.22 May/August low now turned resistance expected to cap. Break above here, if seen, will open up room for stronger correction to the 156.00 congestion. Higher still, will see scope to 156.75/157.00, 50% Fibonacci retracement and consolidation area. Negative weekly studies highlights room for further losses going forward to retrace gains from the April 2025 year low. Lower will see extension to retest strong support at the 152.10 January current year low then 152.00 level and 2022/2023 year highs.