Published: 2026-07-24T04:34:48.000Z
Chart USD/MYR Update: Higher in consolidation from 4.0650/4.0600 lows
1
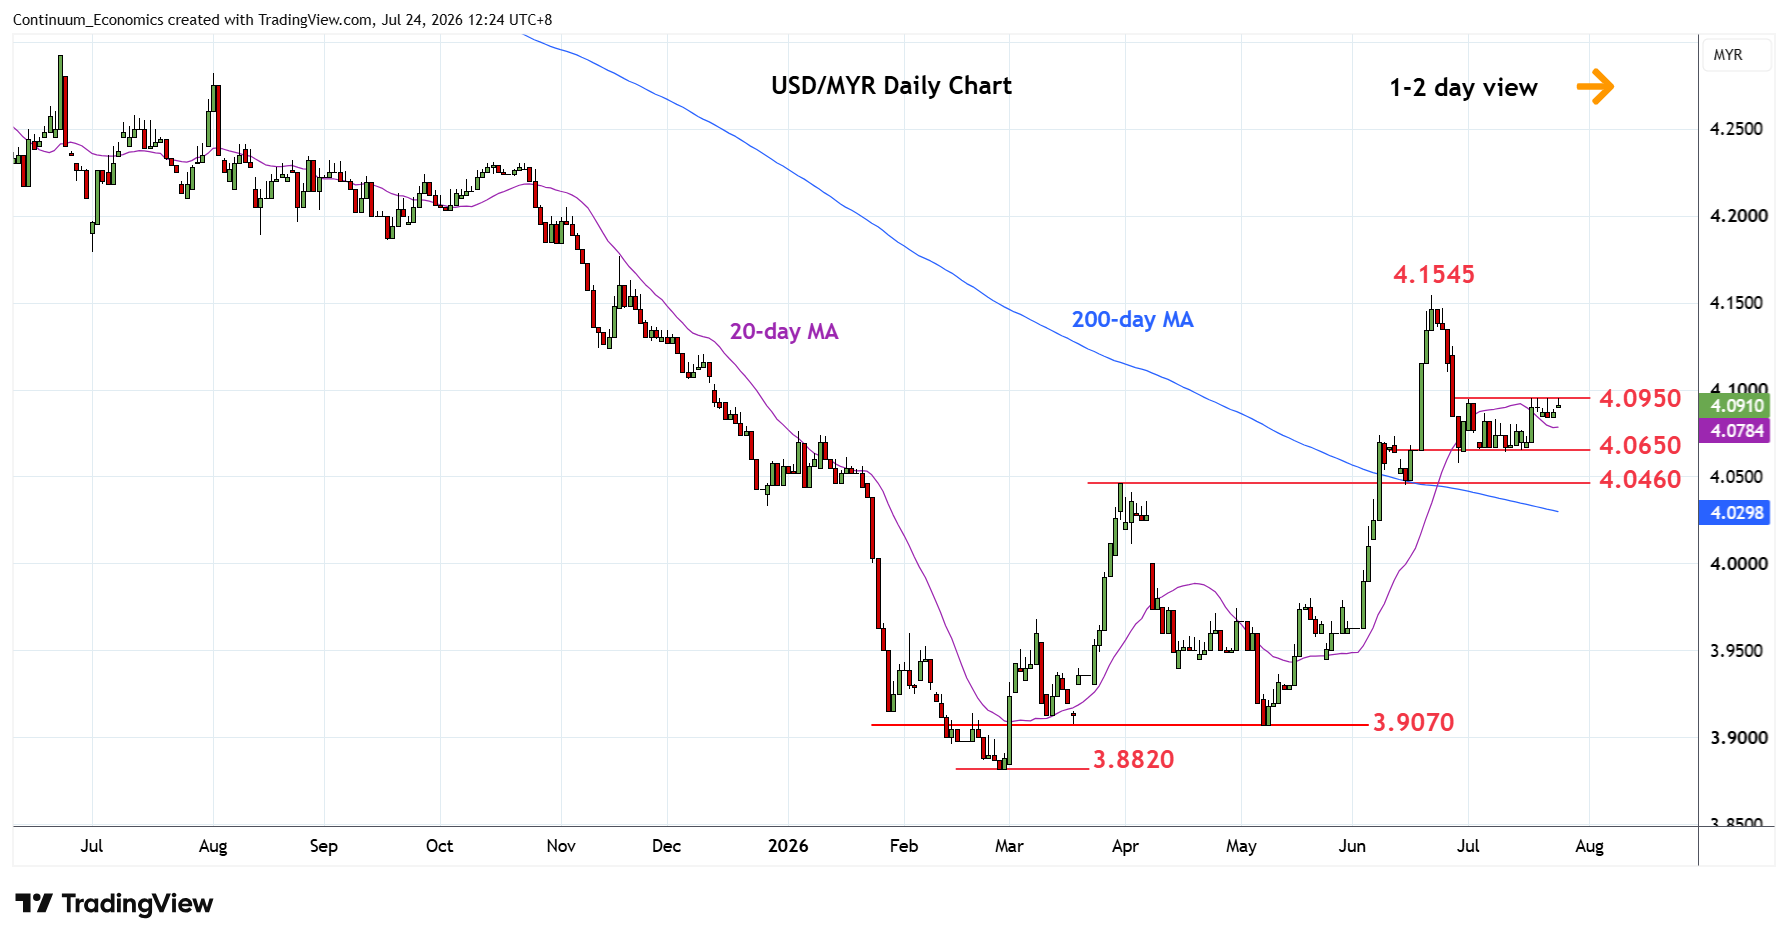
Pressuring resistance at 4.0950 as prices consolidate losses from the 4.1545 June high
| Levels | Imp | Comment | Levels | Imp | Comment | |||
|---|---|---|---|---|---|---|---|---|
| R4 | 4.1545 | ** | 22 Jun YTD high | S1 | 4.0650/00 | * | congestion | |
| R3 | 4.1300 | * | intraday congestion | S2 | 4.0460 | ** | Mar high | |
| R2 | 4.1100 | * | congestion | S3 | 4.0200 | * | congestion | |
| R1 | 4.0950 | * | 1 Jul high | S4 | 4.0000 | * | figure |
Asterisk denotes strength of level
04:30 GMT - Pressuring resistance at 4.0950 as prices consolidate losses from the 4.1545 June high. Daily and weekly studies are unwinding oversold readings and suggest scope for break here to see stronger bounce towards resistance at the 4.1100/4.1300 congestion area. Corrective gains are expected to give way to renewed selling pressure later. Meanwhile, support remains at the 4.0650/00 area. Break here will see room for deeper pullback to retrace the May/June rally to strong support at 4.0460. Below the latter will see extension to the 4.0200 congestion and 4.0000 figure.