Published: 2026-07-22T16:31:48.000Z
Chart USD/MXN Update: Consolidating - studies under pressure
3
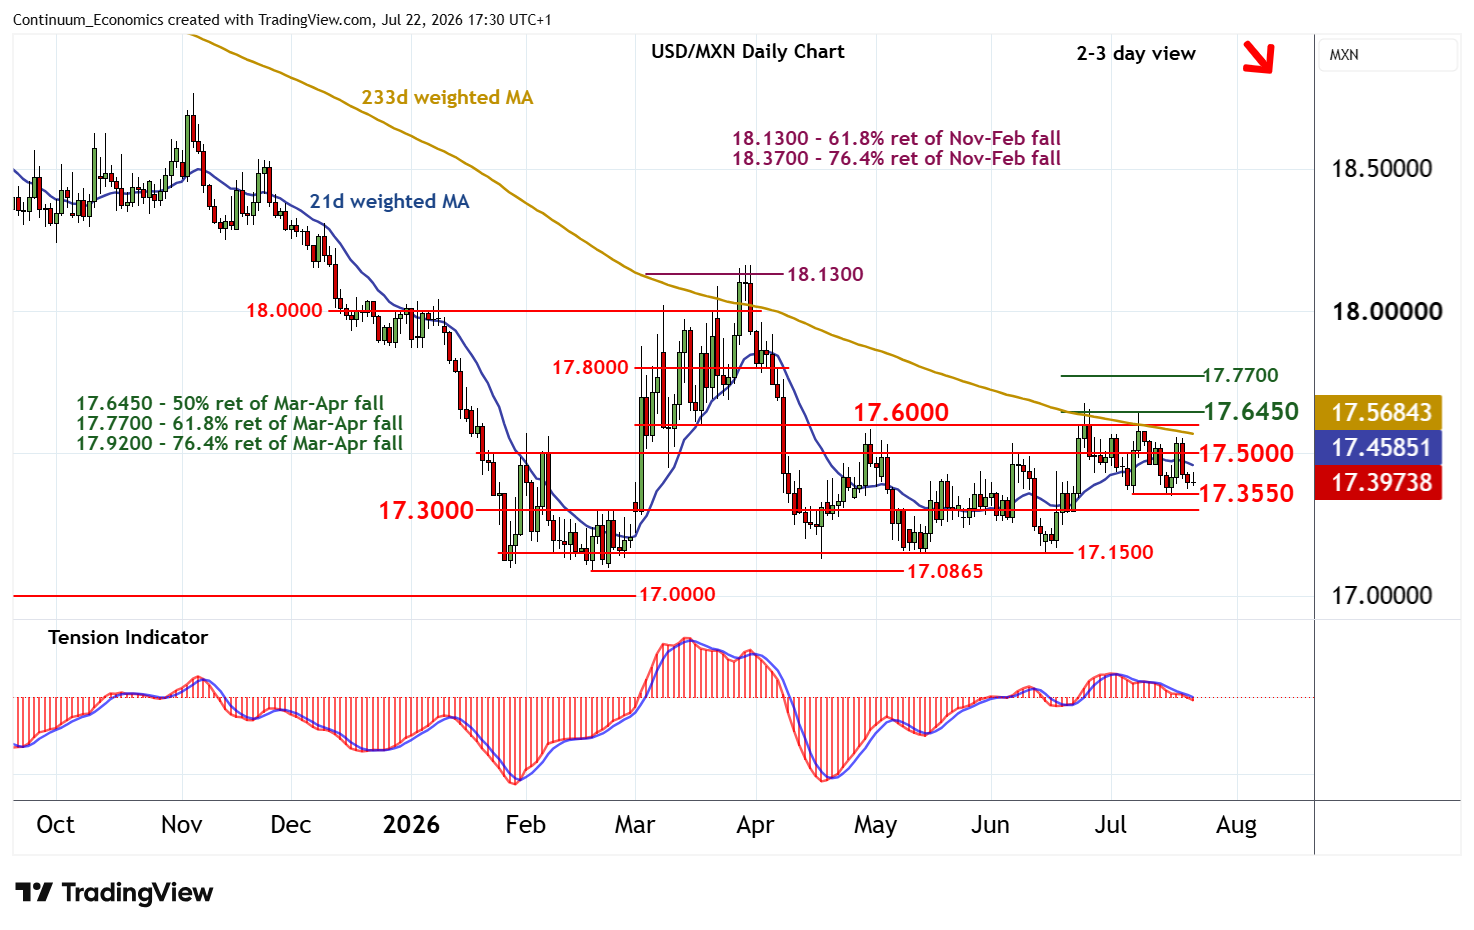
The tests above congestion resistance at 17.5000 have not been sustained
| Levels | Imp | Comment | Levels | Imp | Comment | |||
|---|---|---|---|---|---|---|---|---|
| R4 | 17.7700 | ** | 61.8% ret of Mar-Apr fall | S1 | 17.3550~ | ** | 7 Jul (w) low | |
| R3 | 17.6450 | ** | 50% ret of Mar-Apr fall | S2 | 17.3000 | * | break level | |
| R2 | 17.6000 | ** | congestion | S3 | 17.1500 | * | congestion | |
| R1 | 17.5000 | ** | congestion | S4 | 17.0865 | ** | 18 Feb YTD low |
Asterisk denotes strength of level
17:00 BST - The tests above congestion resistance at 17.5000 have not been sustained, with prices falling sharply into consolidation above the 17.3550~ weekly low of 7 July. Daily readings have turned down and overbought weekly stochastics are also under pressure, highlighting room for a test beneath here towards 17.3000. However, the rising weekly Tension Indicator and mixed longer-term charts should limit any deeper losses in renewed buying interest/consolidation above congestion around 17.1500. Meanwhile, resistance remains at 17.5000 and should cap any immediate tests higher.