Published: 2026-06-15T05:01:37.000Z
Chart USD/INR Update: Extend losses from 96.9600 historic high
1
Consolidation above the 94.7275 low has given way to fresh selling pressure the break the 3-week flag pattern
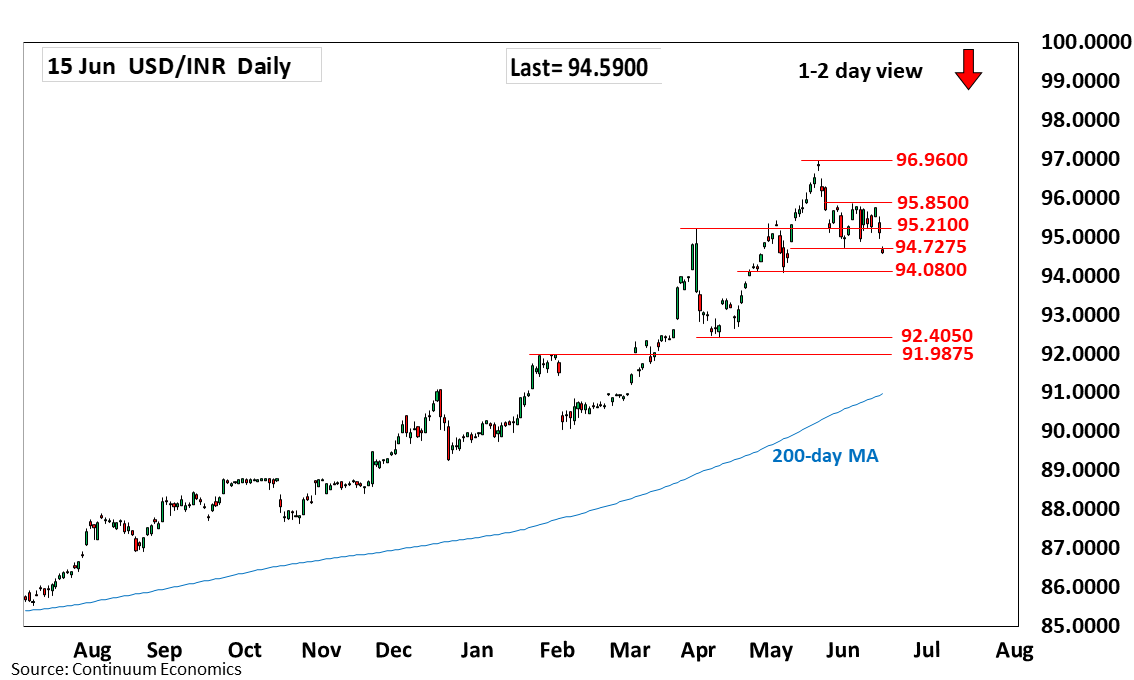
| Level | Comment | Level | Comment | |||||
|---|---|---|---|---|---|---|---|---|
| R4 | 96.9600 | ** | 20 May all-time high | S1 | 94.0800 | ** | May low | |
| R3 | 96.0000 | * | figure | S2 | 94.0000 | figure | ||
| R2 | 95.8500 | ** | 3 Jun high | S3 | 93.4100 | ** | 15 Apr high | |
| R1 | 95.2100 | * | Mar high | S4 | 93.0000 | * | figure, congestion |
Asterisk denotes strength of level
05:00 GMT - Consolidation above the 94.7275 low has given way to fresh selling pressure the break the 3-week flag pattern and extend losses from the 96.9600 May all-time high. Lower will see room to further retrace the gains from the April low to strong support at the 94.0800/94.0000 area. Lower still, will see extension to support at 93.4100 support and the 93.0000 figure. Meanwhile, resistance is lowered to 95.2100 March high which is expected to cap and sustain losses from resistance at the 95.8500 high of 3 June.