Published: 2026-07-23T03:36:52.000Z
Chart USD/THB Update: Consolidating at 33.80
1
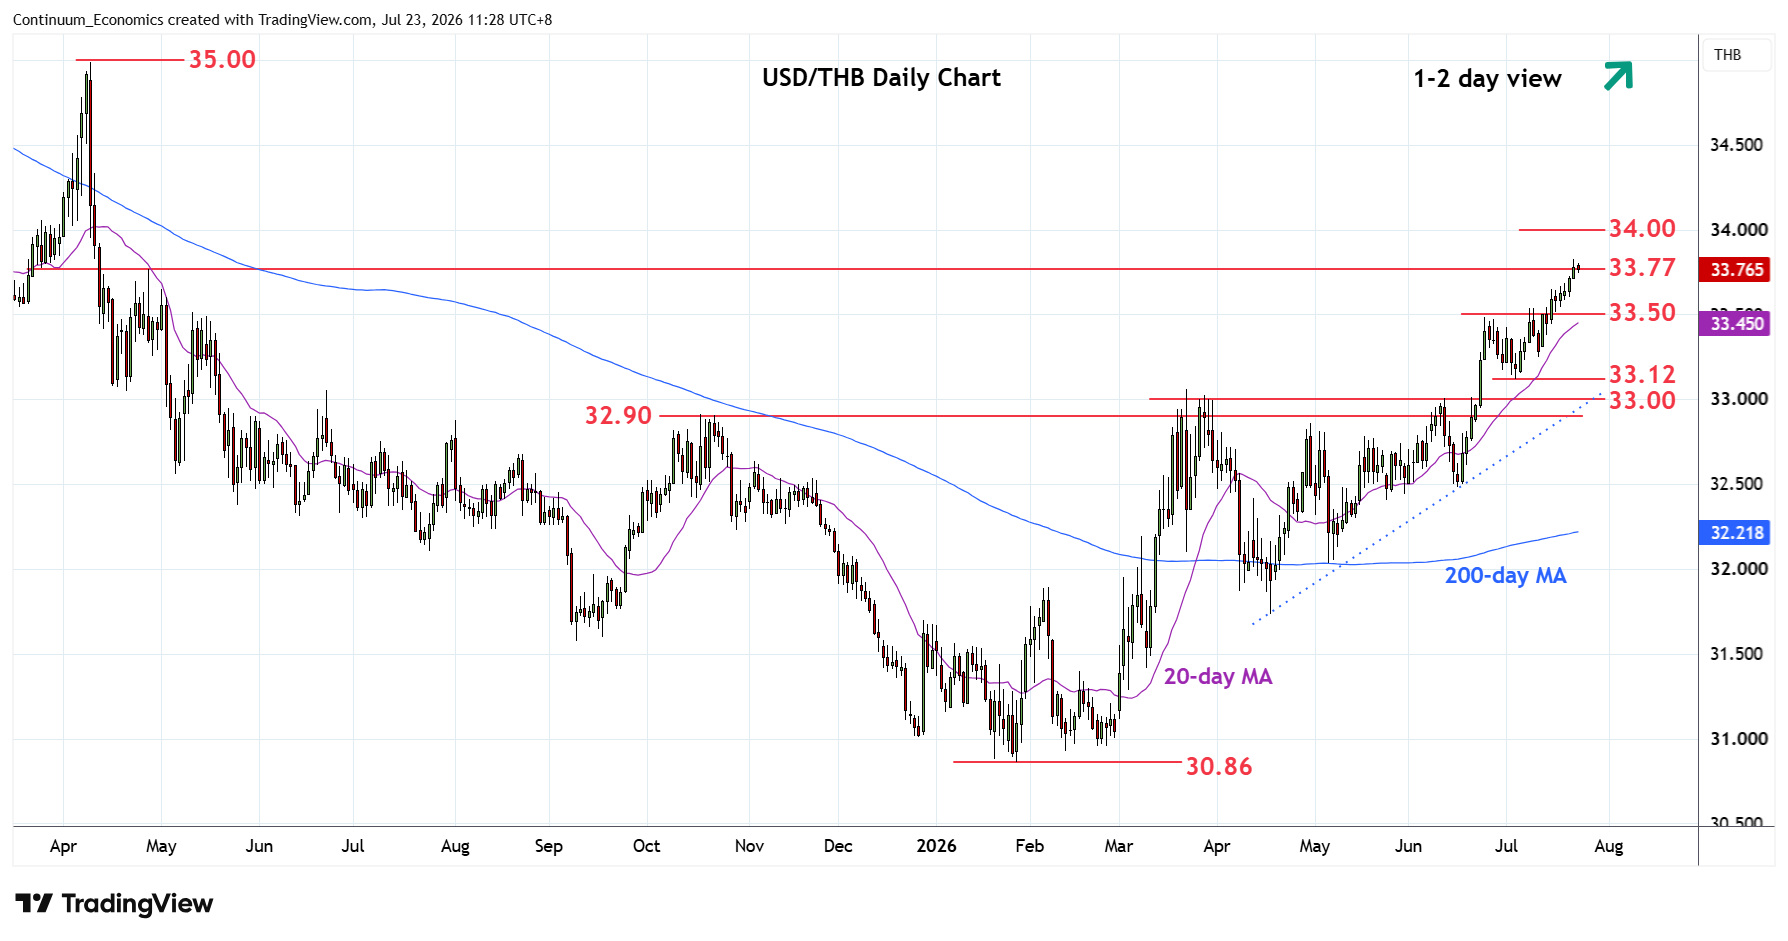
Break above 33.77 resistance see prices extending gains to fresh year high at 33.82
| Level | Comment | Level | Comment | |||||
|---|---|---|---|---|---|---|---|---|
| R4 | 34.50 | * | congestion | S1 | 33.50 | * | congestion | |
| R3 | 34.32 | * | Mar 2025 high | S2 | 33.25 | 10 Jul low | ||
| R2 | 34.10 | * | Dec 2023 low | S3 | 33.12 | ** | 3 Jul low | |
| R1 | 34.00 | * | 76.4% 2025/2026 fall | S4 | 33.00/05 | ** | congestion, Mar high |
Asterisk denotes strength of level
03:35 GMT - Break above 33.77 resistance see prices extending gains to fresh year high at 33.82. Higher will see room for extension to target the 34.00, 76.4% Fibonacci level where reaction is expected as prices push deep into overbought areas on both daily and weekly studies. Meanwhile, support at the 33.50/48 congestion and June high which should underpin. Break here will ease the upside pressure and open up room for deeper pullback to strong support at the 33.25/33.12 area. Would take break here to fade the upside pressure and see pullback to 33.00/32.90 neckline of a 10-month bottom pattern.