Published: 2026-09-03T02:25:45.000Z
Chart USD/SGD Update: Leaning lower in choppy trade
2
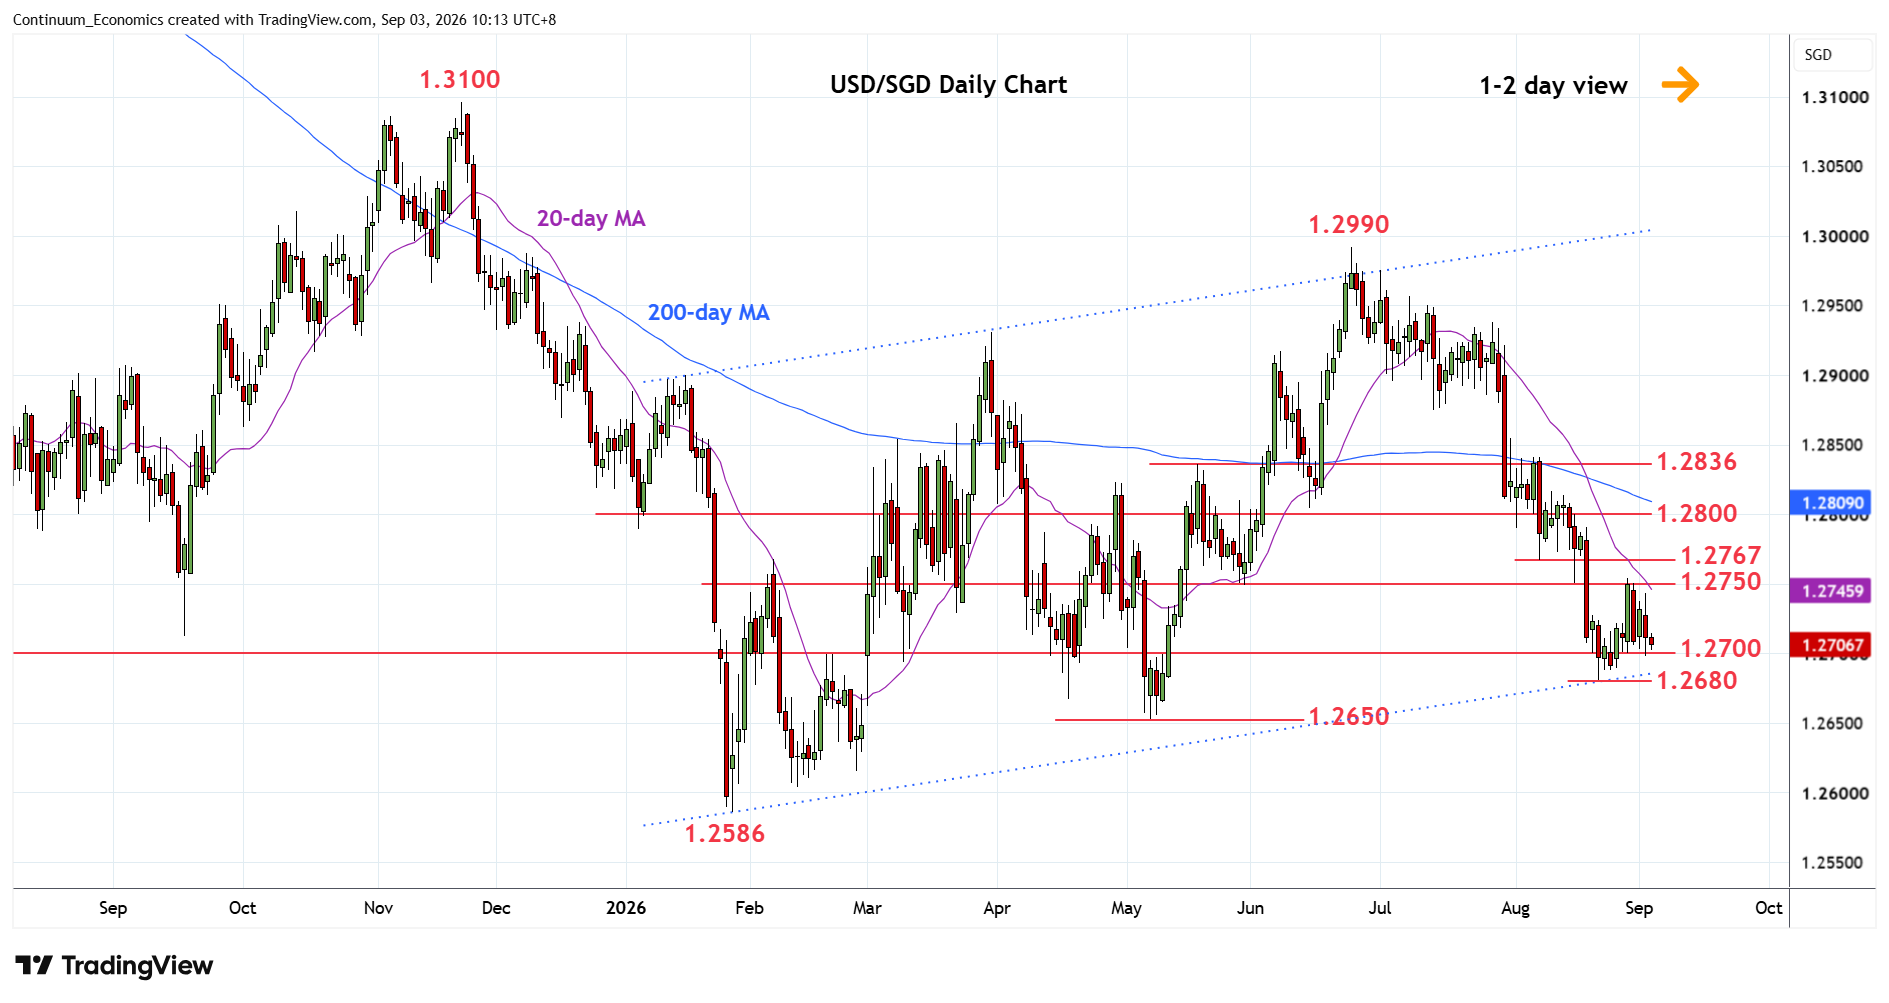
Leaning lower in choppy trade following rejection from the 1.2750 bounce high
| Level | Comment | Level | Comment | ||||
|---|---|---|---|---|---|---|---|
| R4 | 1.2850 | * | congestion | S1 | 1.2700 | * | congestion |
| R3 | 1.2836 | ** | May high | S2 | 1.2680 | * | 21 Aug low |
| R2 | 1.2800 | * | congestion | S3 | 1.2650 | ** | May low |
| R1 | 1.2750/67 | * | congestion, 7 Aug low | S4 | 1.2586 | ** | 28 Jan YTD low |
Asterisk denotes strength of level
02:15 GMT - Leaning lower in choppy trade following rejection from the 1.2750 bounce high. Pressure return to the 1.2700 level and see risk for break here to expose the 1.2680 August low to retest. Break here will see room for extension to the 1.2650 May low and 1.2586, January current year low. Meanwhile, strong resistance at the 1.2750/67 previous lows of 7 and 17 August now expected to cap. Would needed to clear this to open up room for stronger corrective bounce to retrace losses from the June current year high towards strong resistance at 1.2800/36 congestion and May high.