Published: 2026-06-10T05:51:37.000Z
Chart USD/INR Update: Extend consolidation below 95.8500
1
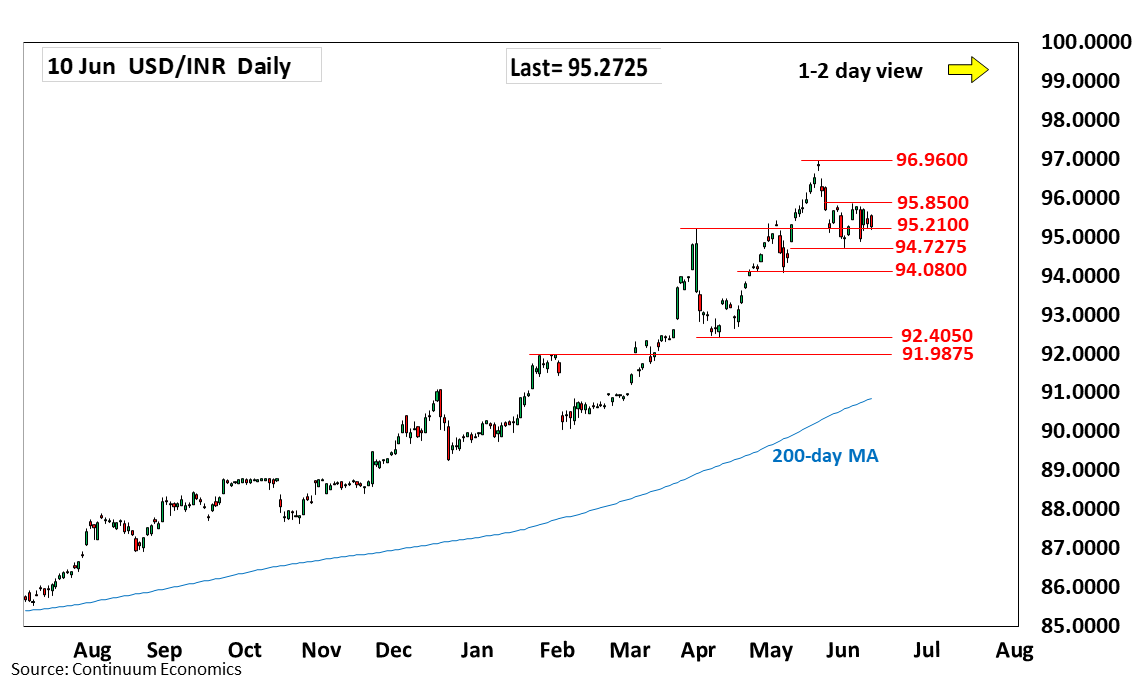
Little change, as prices extend consolidation below resistance at the 95.8500, 3 June high
| Level | Comment | Level | Comment | |||||
|---|---|---|---|---|---|---|---|---|
| R4 | 97.1000 | projection | S1 | 95.2100 | * | Mar high | ||
| R3 | 96.9600 | ** | 20 May all-time high | S2 | 94.7275 | ** | 1 Jun low | |
| R2 | 96.0000 | * | figure | S3 | 94.0800 | ** | May low | |
| R1 | 95.8500 | ** | 3 Jun high | S4 | 93.4100 | ** | 15 Apr high |
Asterisk denotes strength of level
05:50 GMT - Little change, as prices extend consolidation below resistance at the 95.8500, 3 June high. While the latter caps, scope is seen for pullback to retest the 94.7275 low. Break of the latter will see deeper pullback to extend losses from the 96.9600 May all-time high to strong support at the 94.0800/94.0000, May low and congestion area. Lower still, will see room to strong support at 93.4100 high of 15 April and the 93.0000 figure. Meanwhile, resistance at the 95.7925/95.8500 highs are expected to cap and sustain losses from the 96.9600 all-time high.