Published: 2026-11-10T04:34:05.000Z
Chart USD/IDR Updates: Consolidating at 18000, scope for break later
1
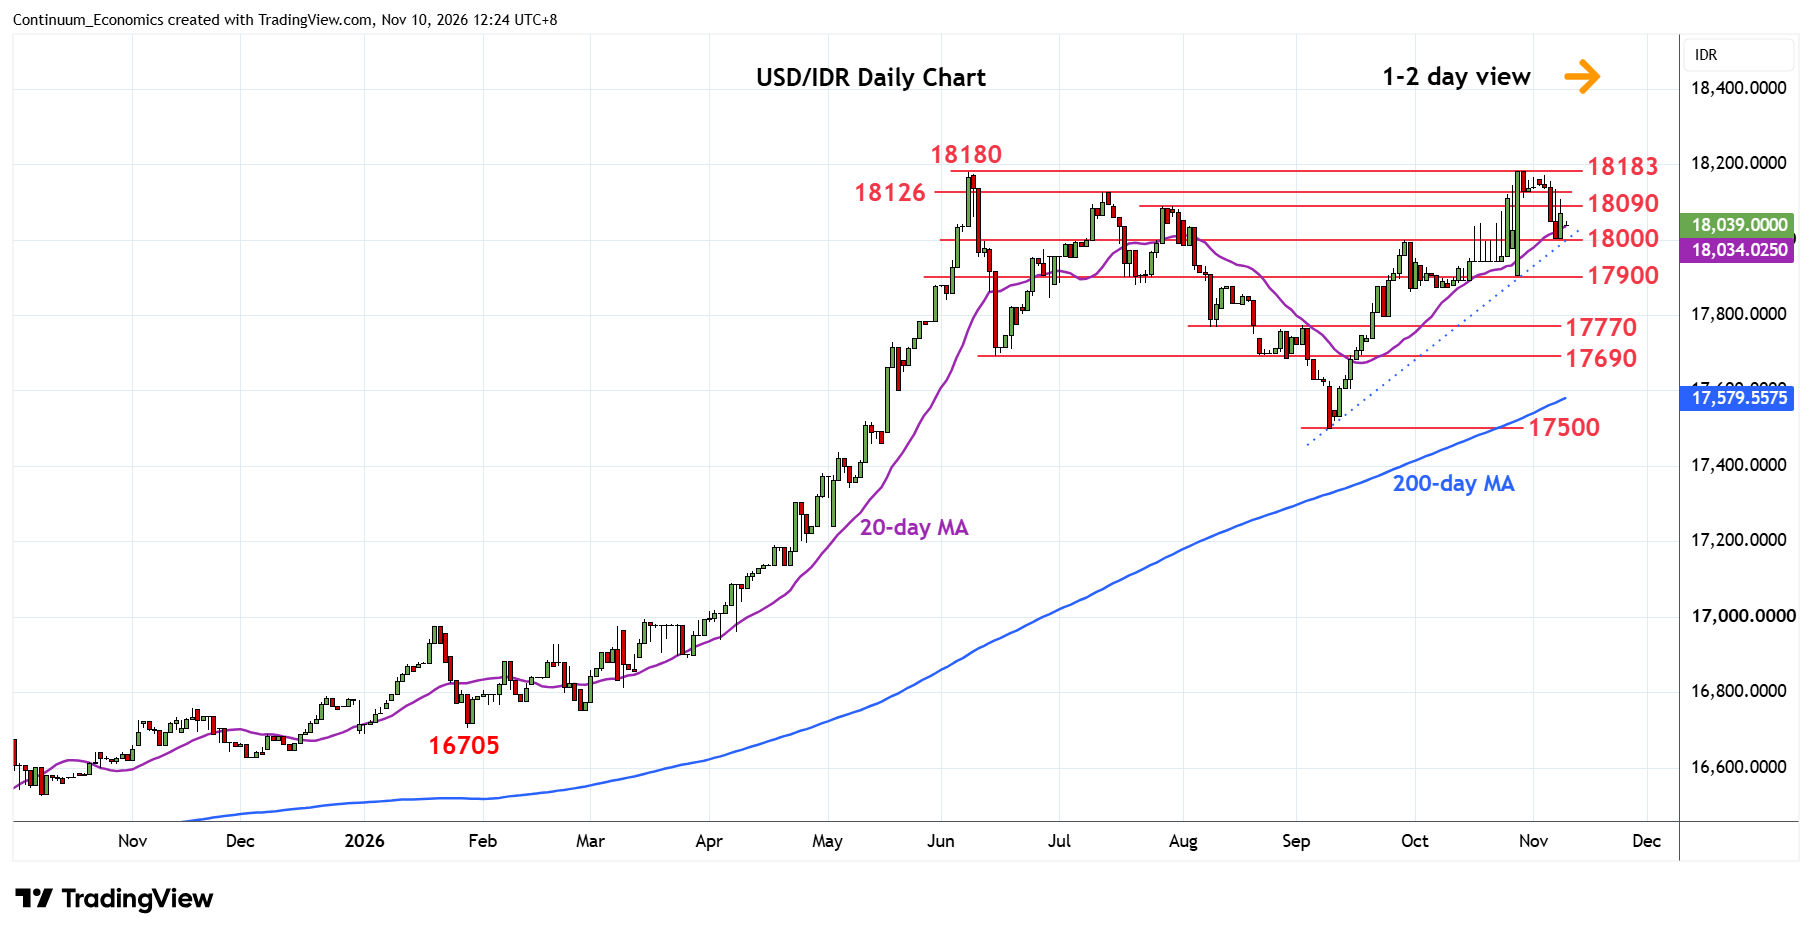
Turned up from test of the 18000 level as prices consolidate losses from the 18183 all-time high
| Levels | Imp | Comment | Levels | Imp | Comment | |||
|---|---|---|---|---|---|---|---|---|
| R4 | 18500 | figure | S1 | 18000 | ** | Sep high | ||
| R3 | 18300 | projection | S2 | 17900 | * | congestion | ||
| R2 | 18183 | ** | 28 Oct all-time high | S3 | 17860 | * | 30 Sep low | |
| R1 | 18090/126 | * | Jul highs | S4 | 17770 | * | 10 Aug low |
Asterisk denotes strength of level
04:30 GMT - Turned up from test of the 18000 level as prices consolidate losses from the 18183 all-time high. Negative daily studies and overbought weekly chart suggesting consolidation here giving way to deeper pullback later. Break of the 18000 level will fade the upside pressure and see deeper pullback to retrace strong gains from the 17500 Spetember low. Meanwhile, resistance at the 18090/18126 July highs are expected to cap and sustain losses from the 18183 high. Break here, if seen, will see room to Fibonacci extension targets at 18300 and the 18500/18550 area.