Published: 2026-07-15T05:46:00.000Z
Chart USD/BRL Update: Extend losses from 5.2200 June high
3
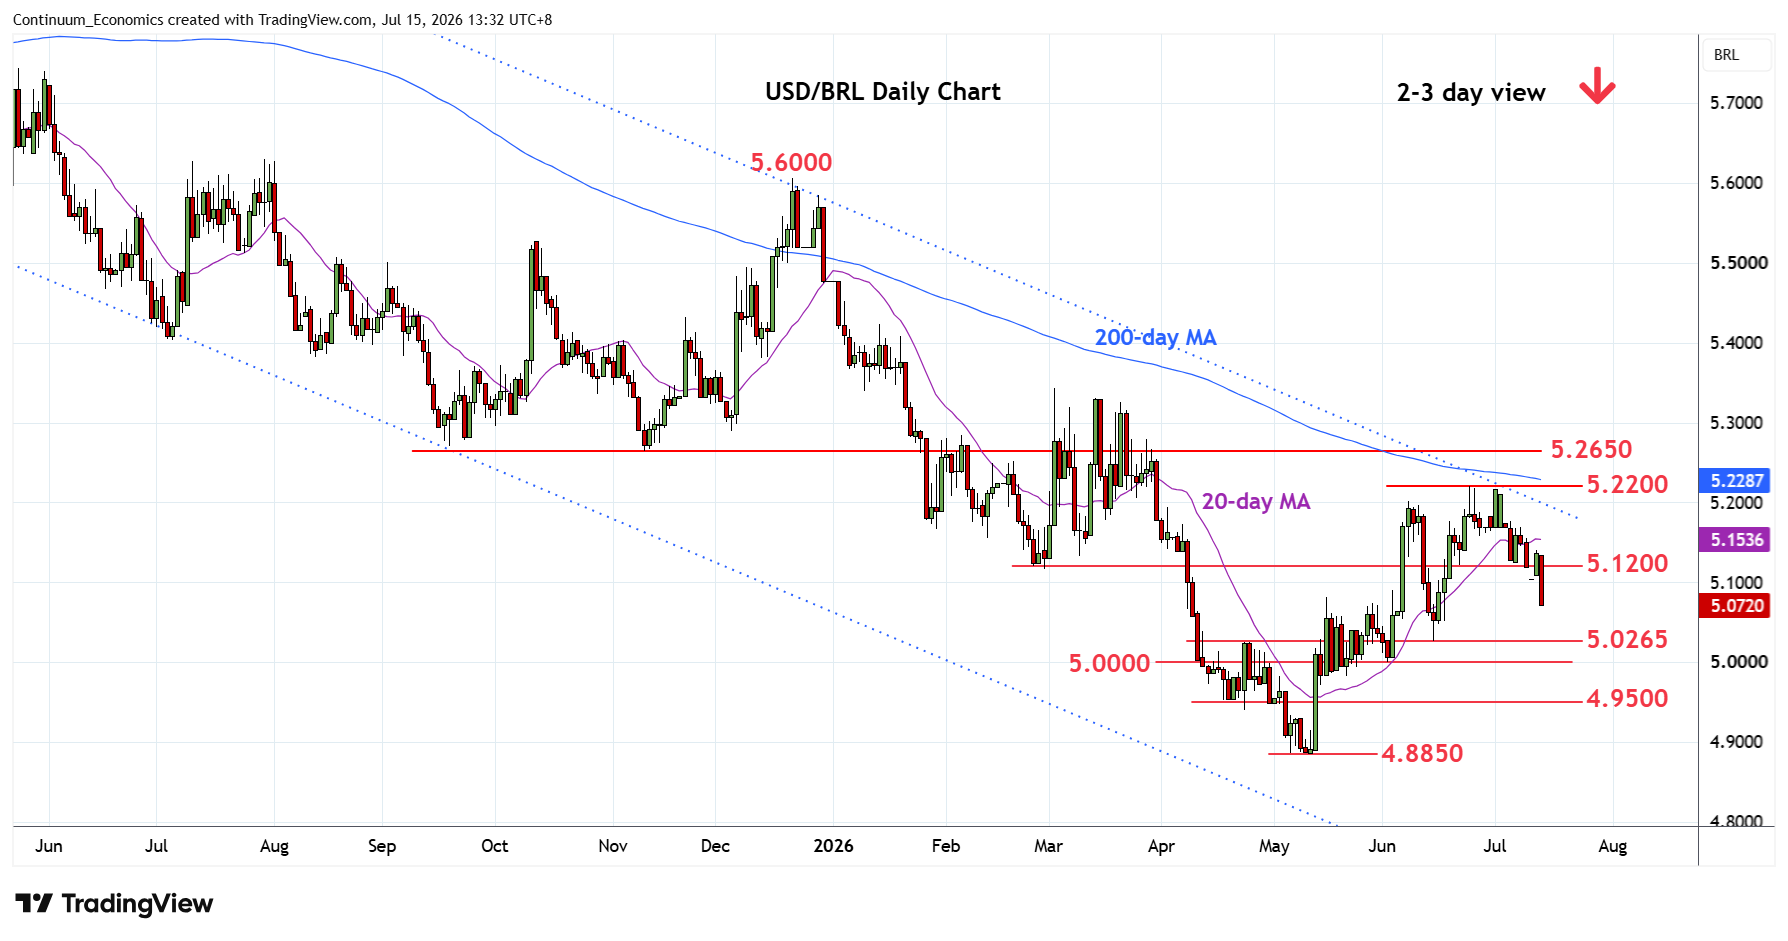
Break of the 5.1200 support see prices extending losses from the 5.2200 June swing high and bearish channel from December 2024
| Levels | Imp | Comment | Levels | Imp | Comment | |||
|---|---|---|---|---|---|---|---|---|
| R4 | 5.2650 | ** | Nov 2025 yr low | S1 | 5.0500 | * | congestion | |
| R3 | 5.2200 | ** | Jun high, channel top | S2 | 5.0265 | ** | 15 Jun low | |
| R2 | 5.1500 | * | congestion | S3 | 5.0000 | * | congestion | |
| R1 | 5.1200 | ** | Feb low | S4 | 4.9500 | * | congestion |
Asterisk denotes strength of level
05:40 GMT - Break of the 5.1200 support see prices extending losses from the 5.2200 June swing high and bearish channel from December 2024 year high. Lower see room to support at 5.0500 congestion then 5.0265 low of 15 June. Both daily and weekly studies are unwinding overbought readings and suggest room for break of these to further extend losses within the bearish channel to 5.0000/4.9500 congestion area. Meanwhile, resistance is lowered to the February low at 5.1200 and this extend to the 5.1500 congestion which should cap any immediate tests higher.