Published: 2026-07-15T02:27:49.000Z
Chart USD/SGD Update: Leaning lower from 1.2990 high
2
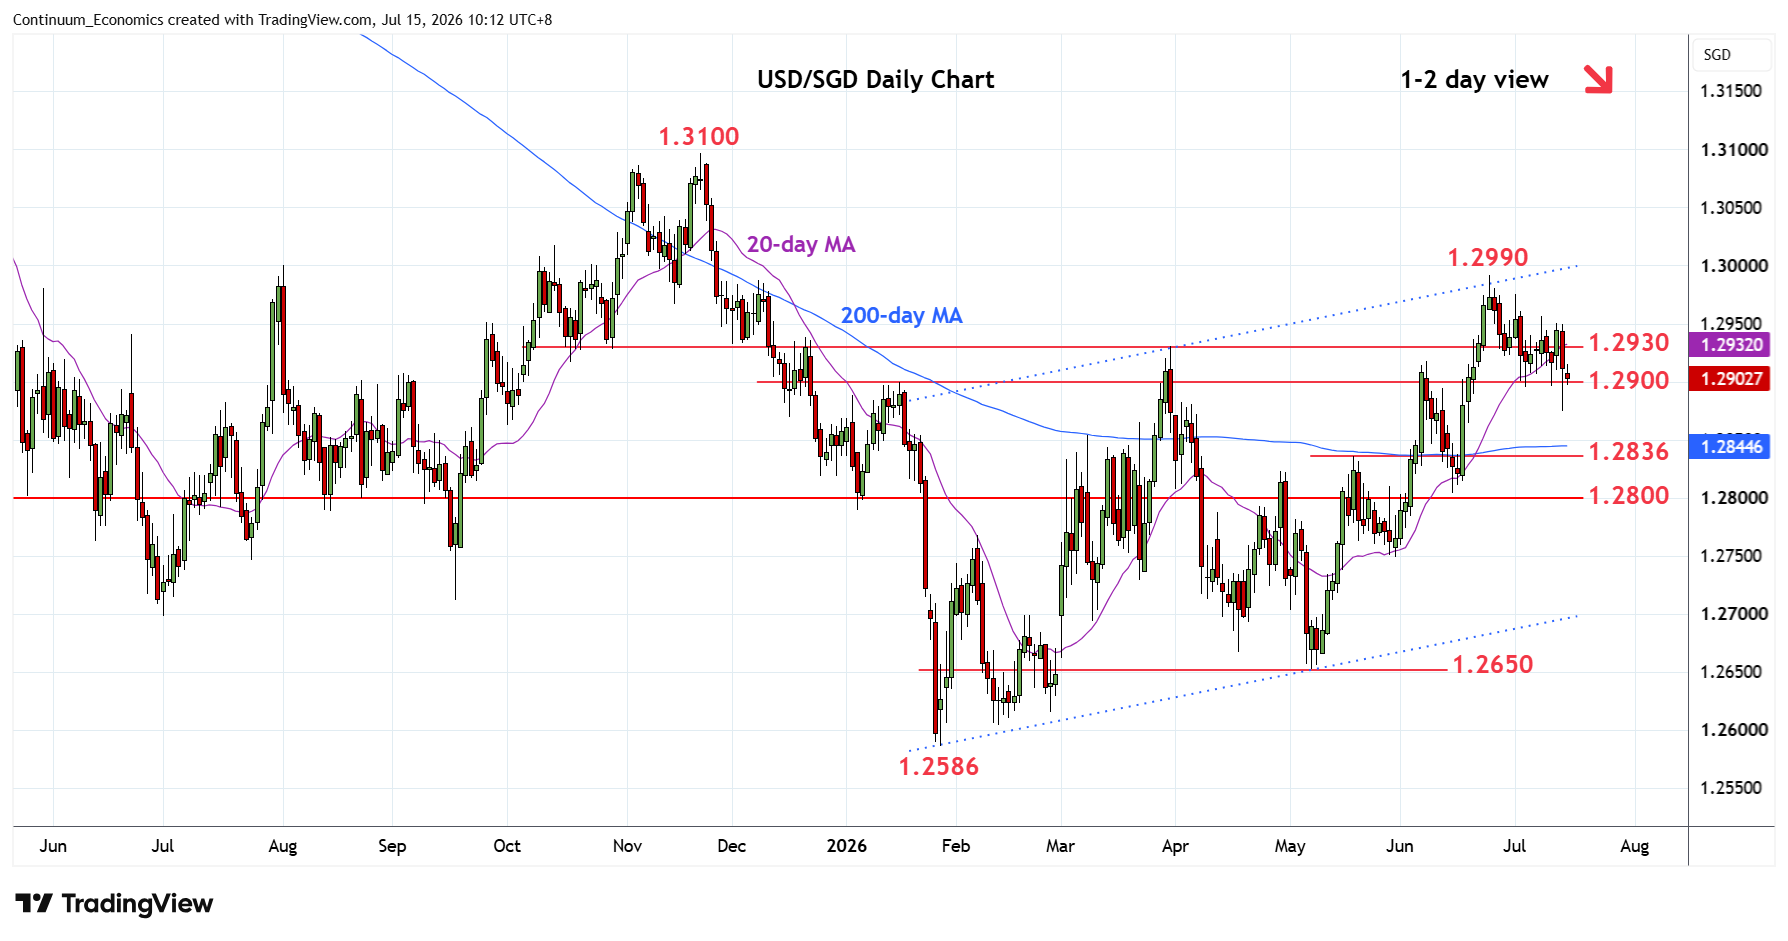
No follow-through on break of the 1.2900 level but choppy trade from the 1.2990 June current year high keep pressure on the downside
| Level | Comment | Level | Comment | ||||
|---|---|---|---|---|---|---|---|
| R4 | 1.3050 | * | congestion | S1 | 1.2900 | * | congestion |
| R3 | 1.3000 | ** | figure, congestion | S2 | 1.2850 | * | congestion |
| R2 | 1.2990 | ** | Jun YTD high | S3 | 1.2836 | ** | May high |
| R1 | 1.2950 | * | congestion | S4 | 1.2805/00 | ** | 15 Jun low, congestion |
Asterisk denotes strength of level
02:20 GMT - No follow-through on break of the 1.2900 level but choppy trade from the 1.2990 June current year high keep pressure on the downside. Daily and weekly studies have turned lower from overbought area and suggest room for deeper pullback to retrace gains from the 1.2650, May swing low. Lower will see room to strong support at 1.2850/36 congestion and May high and the 1.2805 low. Meanwhile, resistance is lowered to 1.2930/1.2950 congestion area which should cap and sustain losses from the 1.2990 high and channel top.