Published: 2026-10-29T03:01:44.000Z
Chart USD/MYR Update: Sharply lower
1
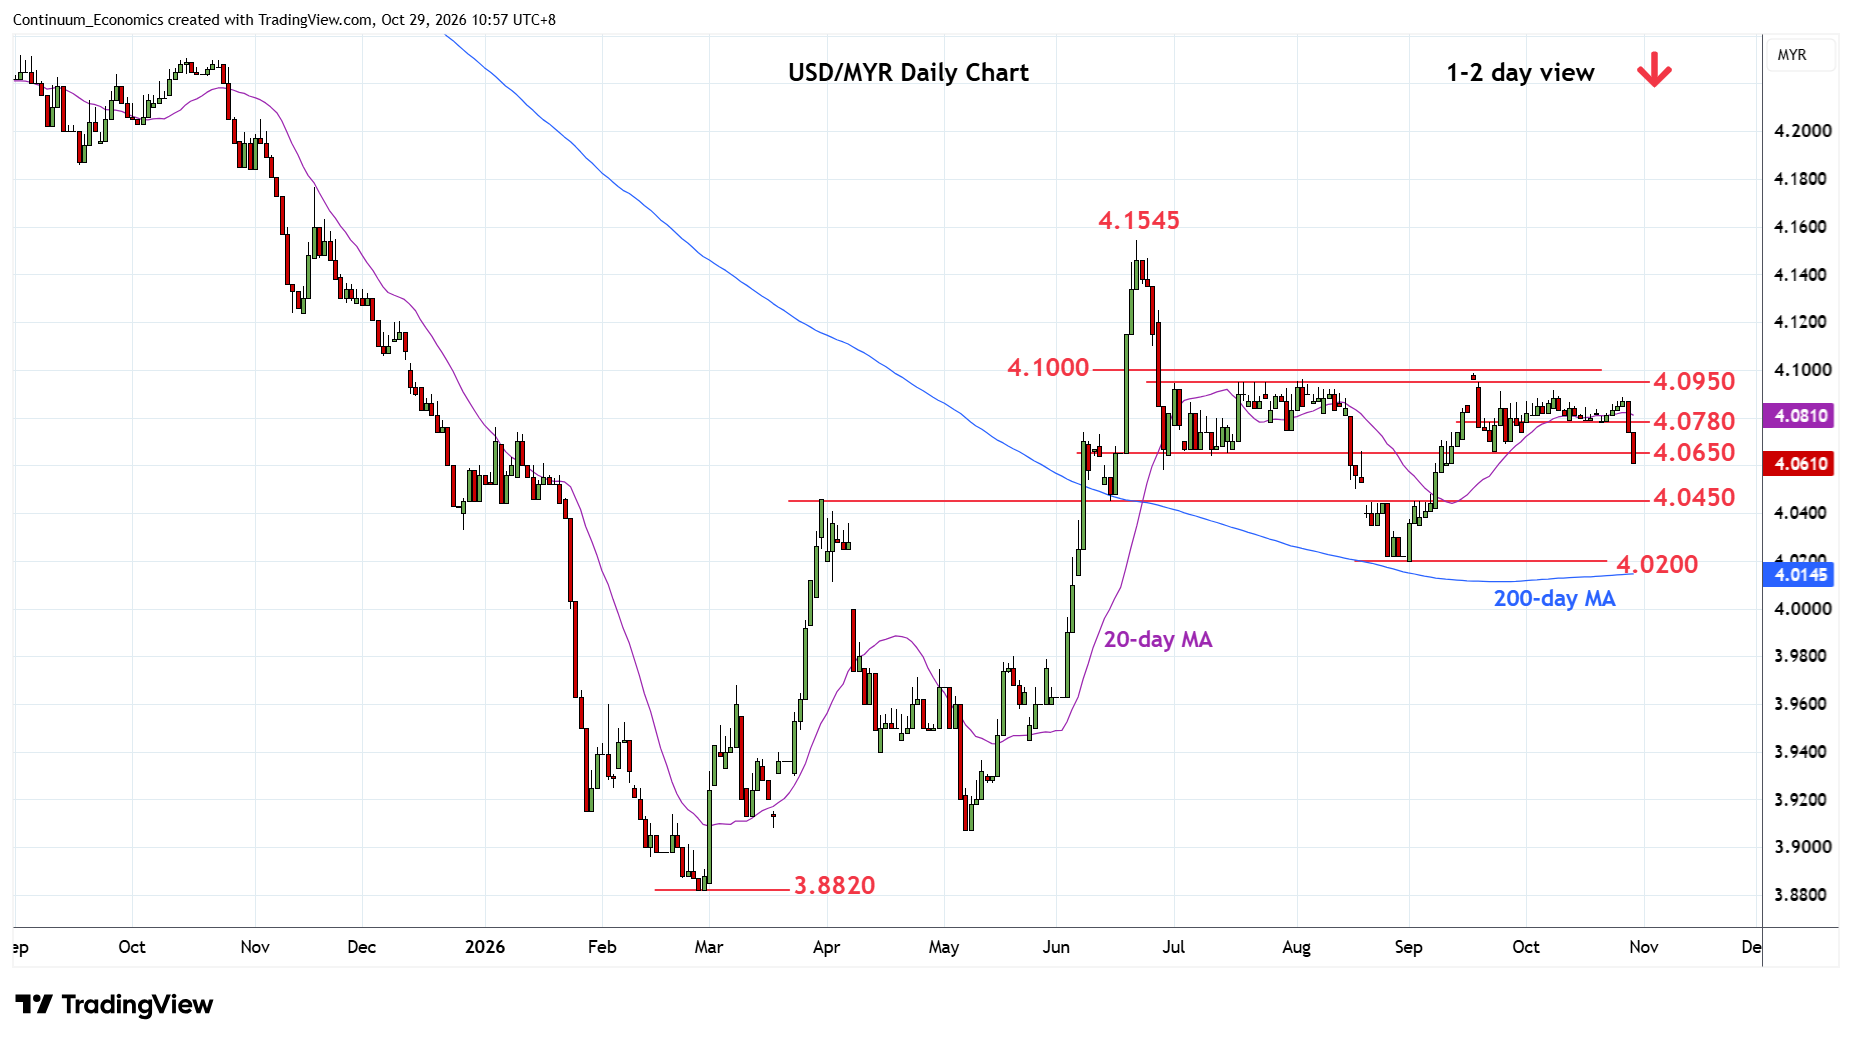
Sharply lower following break of the 4.0780/4.0750 support and congestion area to reach the 4.0650/4.0600 support
| Levels | Imp | Comment | Levels | Imp | Comment | |||
|---|---|---|---|---|---|---|---|---|
| R4 | 4.0985 | ** | Sep high | S1 | 4.0600 | * | congestion | |
| R3 | 4.0915 | * | 8 Oct high | S2 | 4.0450 | ** | Mar high | |
| R2 | 4.0885 | * | 27 Oct high | S3 | 4.0200 | ** | Sep low | |
| R1 | 4.0780 | ** | 21 Oct low | S4 | 4.0000 | ** | figure, congestion |
Asterisk denotes strength of level
03:00 GMT - Sharply lower following break of the 4.0780/4.0750 support and congestion area to reach the 4.0650/4.0600 support. Daily and weekly studies have turned down from overbought areas and suggest scope for break here to open up room for deeper pullback to retrace the September gains. Lower will see room to support at the 4.0450 March high. Below this will expose the 4.0200 September low to retest. Meanwhile, resistance is lowered to the 4.0750/4.0780 congestion and low of 21 October, now expected to cap.