Published: 2026-11-12T07:11:40.000Z
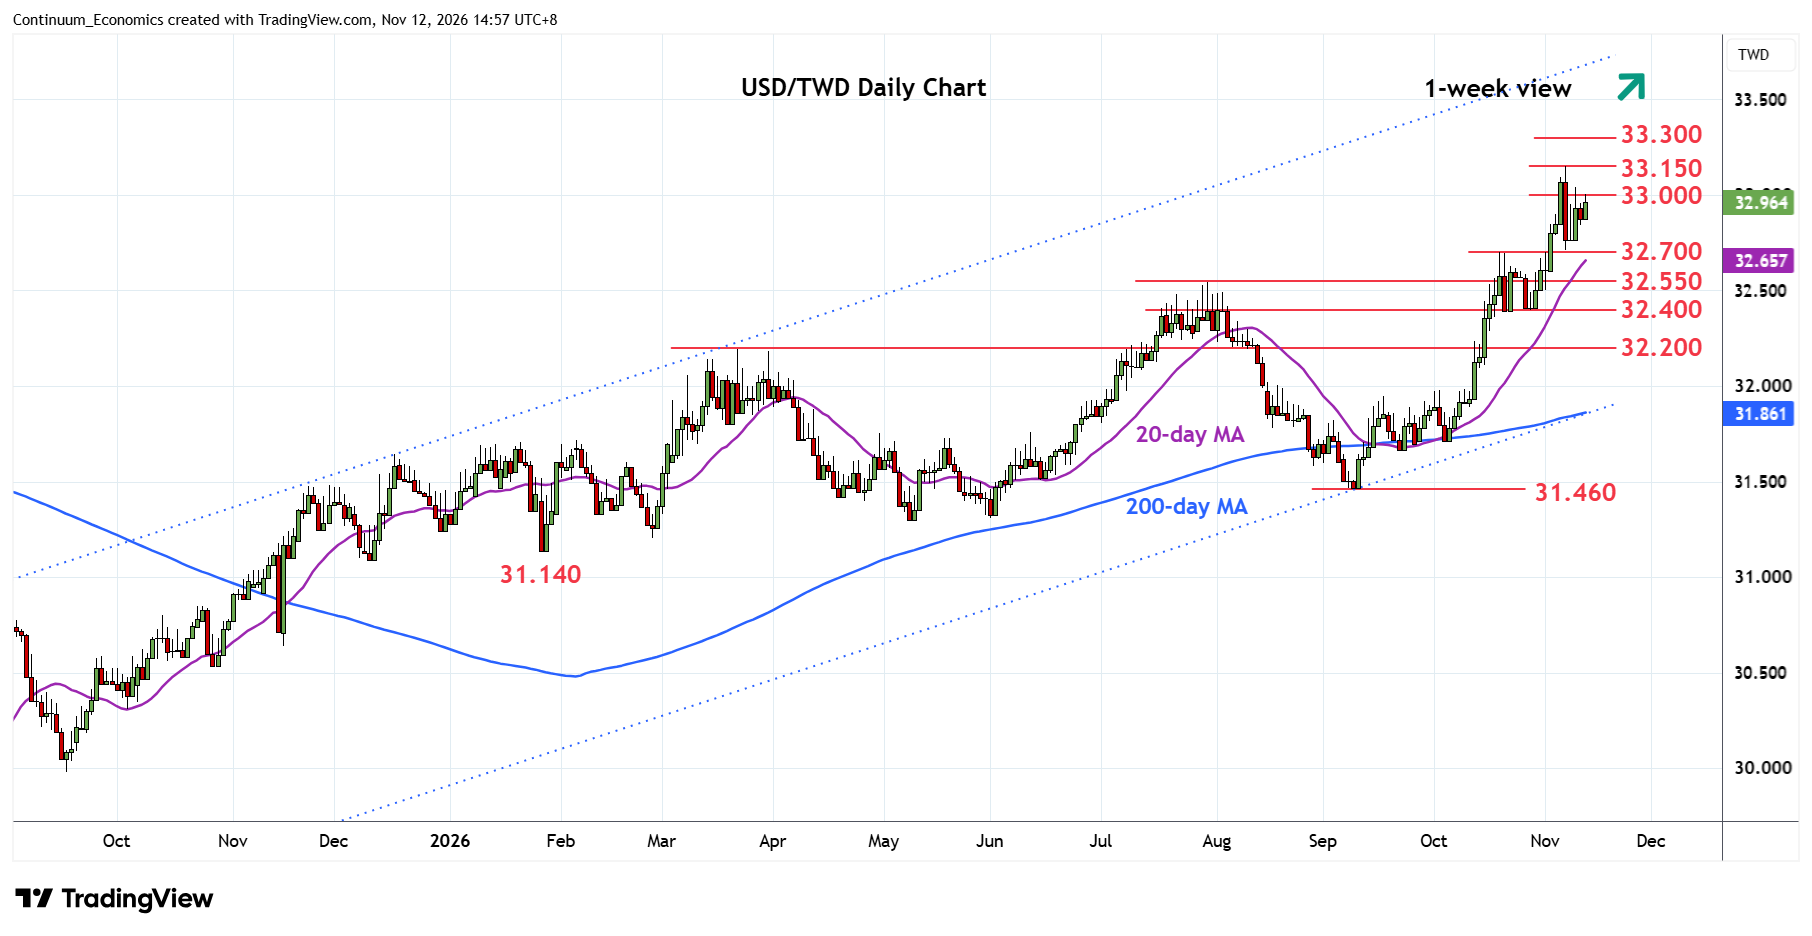
Chart USD/TWD Update: Scope to retest 33.150 high
1
Pushing higher in consolidation from support at the 32.700 October high to retest the 33.000 level
| Levels | Imp | Comment | Levels | Imp | Comment | |||
|---|---|---|---|---|---|---|---|---|
| R4 | 33.310 | * | 2015 year high | S1 | 32.700 | ** | Oct high | |
| R3 | 33.290 | ** | Apr 2025 year high | S2 | 32.550 | ** | Jul high | |
| R2 | 33.150 | ** | 6 Nov YTD high | S3 | 32.400 | * | congestion | |
| R1 | 33.000 | * | congestion | S4 | 32.200 | ** | Mar high |
07:10 GMT - Pushing higher in consolidation from support at the 32.700 October high to retest the 33.000 level. Bullish gains from the 31.460 September low suggest scope for break here to expose the 33.150 current year high to retest. Clearance will extend the broader gains from the July 2025 year low to retest the 33.290, April 2025 year high. Above the latter, will see scope for extension to resistance at 33.310/33.500 area. Meanwhile, support at the 32.700 October high should underpin. Would take break of these to fade the upside pressure and see deeper corrective pullback to the 32.550/32.400 area and 32.200, March high.