Published: 2026-07-29T05:14:02.000Z
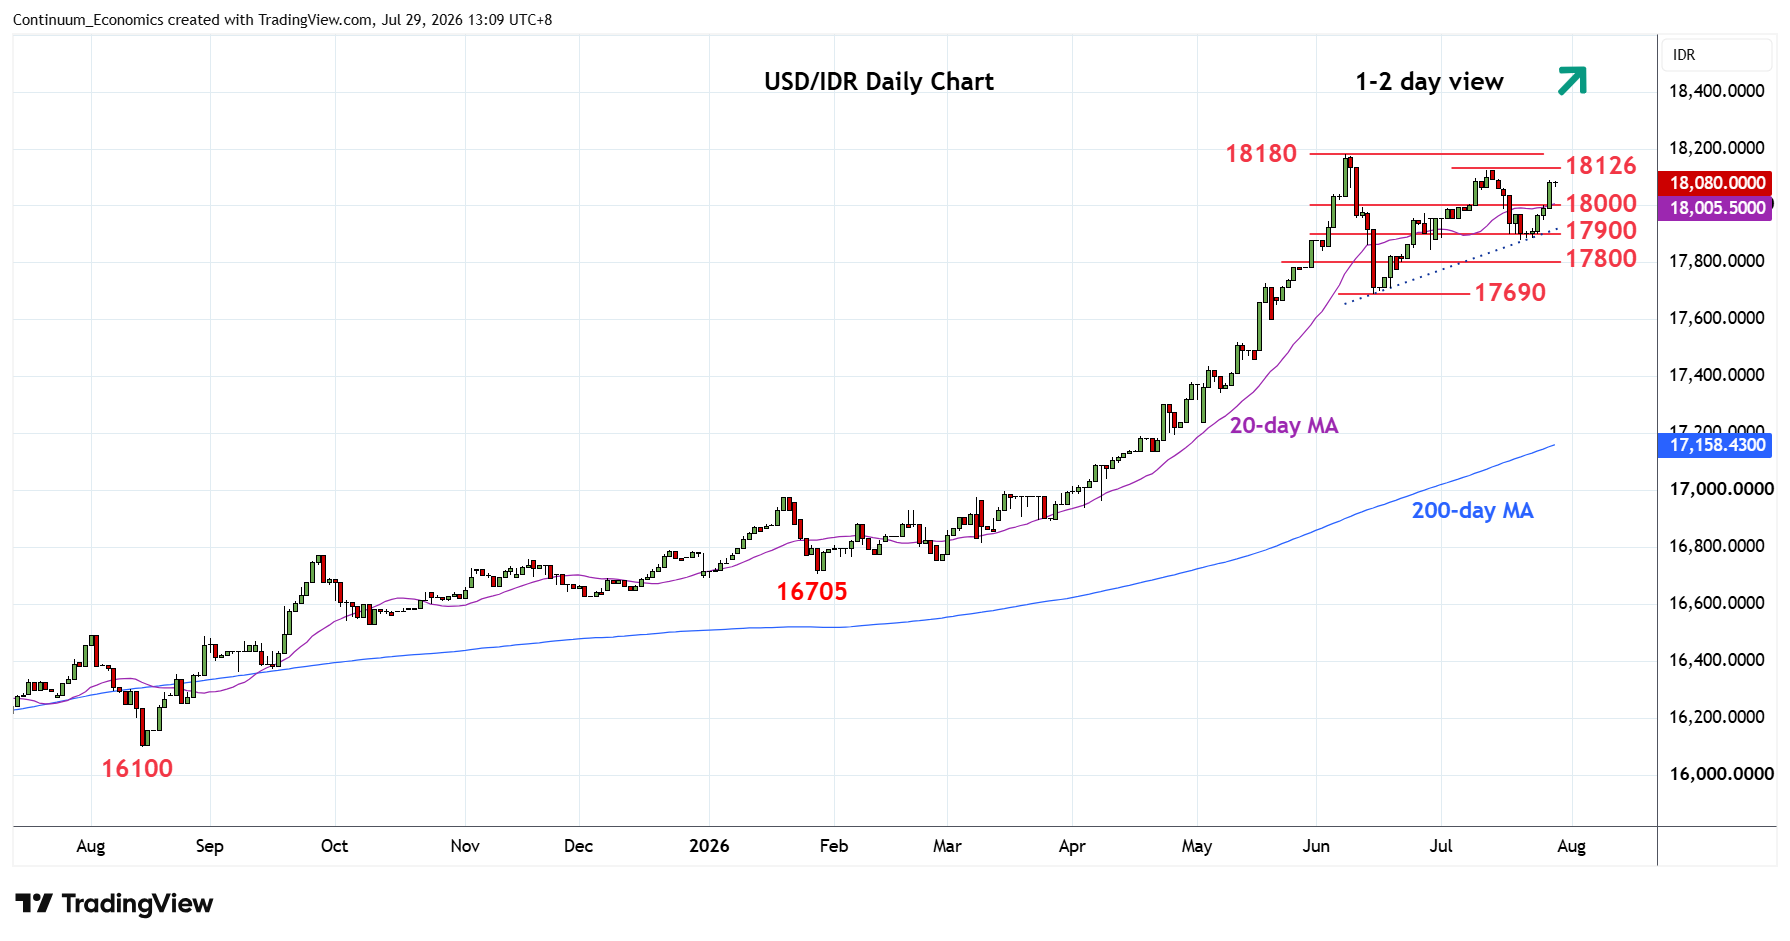
Chart USD/IDR Updates: Pressing higher within an ascending triangle
4
Break above the 18000 level see prices extending bounce from support at the 17900/17880 low of last week
| Levels | Imp | Comment | Levels | Imp | Comment | |||
|---|---|---|---|---|---|---|---|---|
| R4 | 18485 | projection | S1 | 18000 | * | congestion | ||
| R3 | 18200 | projection | S2 | 17880 | ** | 21 Jul low | ||
| R2 | 18180 | ** | 8 Jun all-time high | S3 | 17845 | * | 29 Jun low | |
| R1 | 18126 | * | 13 Jul high | S4 | 17800 | * | congestion |
Asterisk denotes strength of level
04:45 GMT - Break above the 18000 level see prices extending bounce from support at the 17900/17880 low of last week as prices unwind oversold daily studies. Ascending triangle from the June low suggest scope for retest of the 18126 high and where break will see room for extension to retest the 18180 June all-time high. Would expect reaction at the latter but a later break cannot be ruled out to extend the underlying bull trend. Meanwhile, support is raise to the 18000 level which should underpin and sustain bounce from the 17900/17880 area.