Published: 2026-06-15T04:45:51.000Z
Chart USD/IDR Updates: Extending sharp losses
2
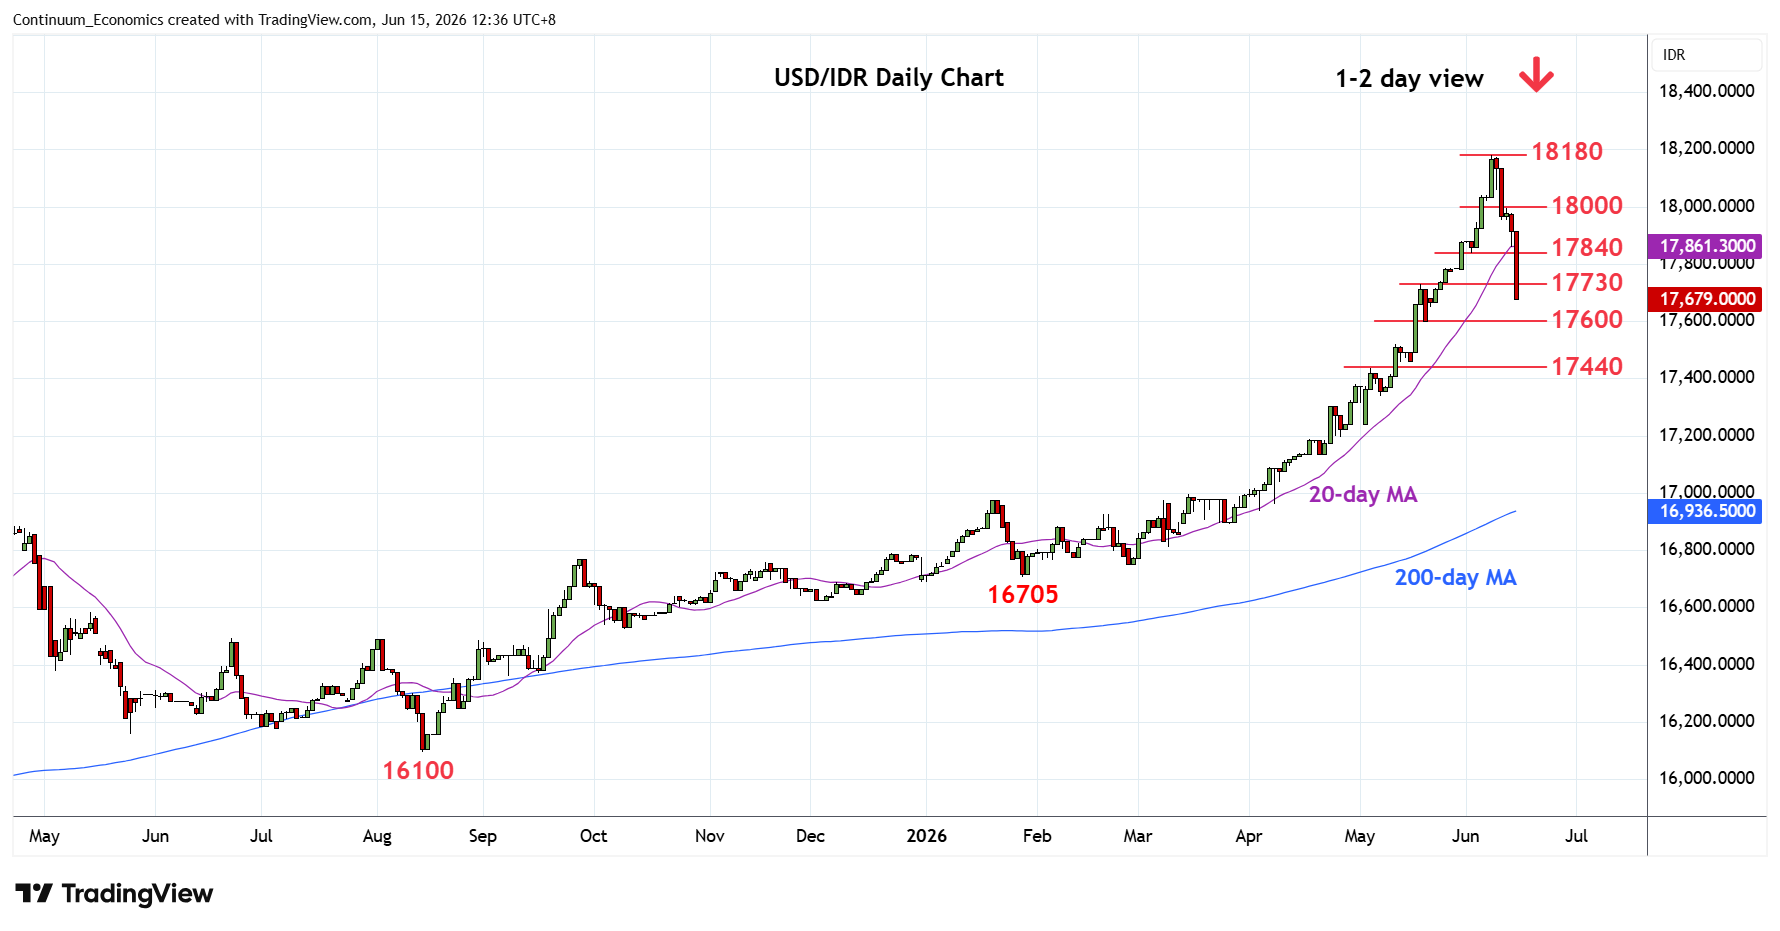
Sharply lower as prices extend pullback from the 18180 all-time high
| Levels | Imp | Comment | Levels | Imp | Comment | |||
|---|---|---|---|---|---|---|---|---|
| R4 | 18200 | projection | S1 | 17600 | * | 38.2% Jan/Jun rally | ||
| R3 | 18180 | ** | 8 Jun all-time high | S2 | 17520 | * | 12 May high | |
| R2 | 18000 | * | figure | S3 | 17440 | * | 5 May high, 50% | |
| R1 | 17840 | * | 2 Jun low | S4 | 17340 | * | 7 May low |
Asterisk denotes strength of level
04:40 GMT - Sharply lower as prices extend pullback from the 18180 all-time high. Break of the 17730 support see room to the support at the 17600 congestion and 38.2% Fibonacci level as prices unwind overbought daily studies and parabolic gains from the 16705, January current year low. Lower still, will see room to 17520/17500 congestion area and 17440, 50% Fibonacci level. Meanwhile, resistance is lowered to the 17800/17840 figure and 2 June low which is expected to cap and sustain pullback from the 18180 high.